Posted on May 7, 2021
Tags:
Categories: aimswebPlus, assessments, literacy

What is aimswebPlus?

We use aimswebPlus, a universal screening, benchmarking, and progress-monitoring tool from Pearson, to assess literacy and math proficiency in grades K-5. These assessments help identify students who are meeting grade- and term-level benchmarks as well as those who may need additional support. This post explains aimswebPlus administration and scoring, as well as how we use the data. For parent guides, click here for grades K-1 and here for grades 2-8

Teachers administer aimswebPlus assessments in literacy and math to kindergarten and first grade students; students in grades 2-5 take the assessments online. Most assessments are timed (1 minute each). The untimed assessments are typically administered to students in grades 2-5.

Most students take multiple assessments, or “subtests,” in both literacy and math. Each subtest measures a specific skill, and scores on each are used to calculate a “composite score.” Composite scores measure student performance on a combination of critical skills. Students in kindergarten, second, third, fourth, and fifth grades take multiple subtests in order to receive a composite score; only one test is required for first grade students to receive a composite score (Table 1).

Before Fall 2020, aimswebPlus literacy assessments were required, and aimswebPlus math assessments were optional. We now require all students in grades K-5 to take both assessments three times each year.

In kindergarten, aimswebPlus literacy assessments focus on letter recognition, letter sounds, and blending. In first grade, the skills shift to oral reading fluency, and assessments in grades 2-5 include identification of common words, oral and silent reading fluency, and reading comprehension.

AimswebPlus math assessments focus on emerging numeracy skills, such as number recognition and quantity conceptualization, in kindergarten. First grade students are assessed on number pair comparisons and math facts, while students in grades 2-5 are assessed on mental computation, triad number comparisons, and math concepts.

Click below for tables that outline the tested skills by grade. Click the subtest name for a test item example. 

AimswebPlus literacy assessments by grade

Table 1. AimswebPlus Literacy: Required Assessments by Grade

Grade(s) Subtest Name (Required for Composite Score) Skills/Topics Assessed
K Letter Naming Fluency (LNF) Number of upper-case and lower-case letters that students can identify in one minute.
K Letter Word Sounds Fluency (LWSF) Number of sounds of letters, syllables, and words that students can identify in one minute.
1-3 Oral Reading Fluency (ORF) Number of words in a story that students read correctly in one minute.
2-5 Reading Comprehension (RC) Number of correct responses to multiple choice reading comprehension questions about six short passages.
2-5 Vocabulary (VOC) Number of correct responses to multiple choice questions about meanings of target words.
4-5 Silent Reading Fluency (SRF) Number of correct responses to multiple-choice questions related to a reading passage.

AimswebPlus math assessments by grade

Table 2. AimswebPlus Math: Required Assessments by Grade

Grade(s) Subtest Name (Required for Composite Score) Skills/Topics Assessed
K Number Naming Fluency (NNF) Amount of numbers between 0 and 20 that students can identify in one minute.
K Quantity Total Fluency (QTF) The total sum of dots within each presented box students can identify in one minute.
K-1 Concepts and Applications (CA) The number of one- and two-step word problems students can solve correctly. This subtest is untimed and 25 questions in length.
1 Number Comparison Fluency - Pairs (NCF-P) Number of instances a student can identify the larger number in a given pair in one minute.
1 Math Facts Fluency - 1 Digit (MFF-1D) The number of simple addition and subtraction problems students can solve correctly in one minute.
2-5 Concepts and Applications (CA) The number of multiple-choice math word problems students answer correctly. This subtest is untimed and 29-31 questions in length.
2-5 Number Comparison Fluency-Triads (NCF-T) The number of instances a student can correctly identify where a given number falls on the number line between the two choices in three minutes.
2-5 Mental Computation Fluency (MCF) The number of multiple-choice mental math problems students can solve and answer correctly in four minutes.

AimswebPlus measures student proficiency and growth using multiple metrics. The District uses these primary metrics to measure student proficiency and growth:

Proficiency Metrics

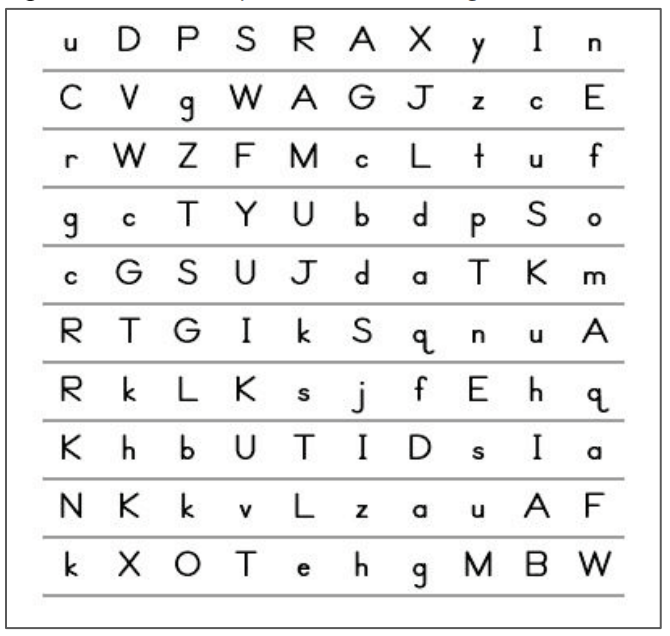
Number of Correct Responses: A student’s number of correct responses is calculated based on the number of cues correctly identified during the timed assessment. For example, kindergarten students who take the LNF, the number of correct responses represents the number of letters identified correctly in one minute. Number of correct responses can be used to compare student performance across assessment periods or school years within grade level. Number of correct responses vary by assessment type and grade.

National Percentile Rank (NPR):  A student’s national percentile rank is a norm-referenced performance measure that compares student’s score with a national reference of scores of students in the same grade who were tested on the same content during the same timeframe.  NPR is useful for understanding a student’s reading ability compared to other students in the same grade nationally. Based on the number of correct responses, each student is assigned a percentile rank in the fall and in the spring. Percentiles range from 0-99. For example, a fall NPR of 23% indicates that on average, students are performing better than 23% of the nationally-normed sample based on their number of correct responses that fall. Analyzing the change in students’ performance based on their NPR frames student performance within the context of a national sample.

Tier Levels:  Based on their composite score, students are placed into a performance tier that indicates their level of risk of not achieving proficiency in key literacy skills by the spring of their current school year. Tier 1 indicates that students are testing “At Target” and are on track to read proficiently. Tier 2 indicates that students need strategic intervention to ensure progress towards proficiency. Tier 3 indicates that students require intensive intervention to make progress towards becoming proficient in math or reading.

Performance Groups: There are six performance groups. We further bucket those six groups into the following four ranges:

  • Well Below Average or Below Average (1-25%),
  • Low Average (26-50%),
  • High Average (51-75%), and
  • Above Average or Well Above Average (76-99%).

These percentages are calculated using National Percentiles. While using composite scores and Tier placements are useful for tracking progress toward the District’s goals, they are not sufficient for making instructional decisions. To better determine what steps should be taken to improve the percentage of students in Tier 1 (“At Target”), we must also closely examine student performance on each of the composite’s subtests. This is important to help identify specific skill gaps that may need to be addressed to help students reach Tier 1. Depending on how a student performs on the subtests that comprise the composite score used to determine a Tier placement, students who fall into the “Below Average” or “Well Below Average” progress monitoring groups are likely to also be placed in Tiers 2 or 3.  Thus, ensuring that students are performing well on all subtests is critical to their Tier placement.

Growth Metrics

Rate of Improvement (ROI): A student’s rate of improvement is calculated based on the number of correct responses a student increased per week between assessment periods (i.e., the difference between the number of correct responses in the spring and the number of correct responses in the fall, divided by the number of weeks between the fall and spring assessments). ROI analyzes student improvement within the context of their own learning rather than within a national sample. It is important to note that because students take assessments at different times within the assessment window, ROI controls for the possible differences in learning that could be attributed to the varying length of time that may pass between assessment periods for different students. For example, a first-grade student with a fall to spring ROI of 1.12 means that between the fall and spring assessment they increased the number of words pronounced correctly on the NWF assessment by 1.12 each week.

Student Growth Percentile (SGP): SGP analyzes the rate of students’ growth (ROI) between assessment periods (fall to winter, winter to spring, fall to spring) compared to a nationally normed sample of students who had a similar fall performance. SGP compares a student’s growth to her “academic peers” (students in the same grade with a similar score history) nationwide. Measured on a 1-99 scale; lower numbers indicate lower relative growth and higher numbers indicate higher relative growth. Students are placed into three growth categories, based on their SGP:  High Growth (SGP between 66th and 99th percentiles), Typical Growth (SGP between 35th and 65th percentiles) and, Low Growth (SGP between 1st and 34th percentiles).

We use aimswebPlus data to track proficiency and growth in grades K-5 using the metrics outlined above. The District looks at this data overall, by Network, and by grade band, as well as by student characteristics (such as race/ethnicity, English Learner status, and Special Education status). We also analyze aimswebPlus data after each benchmark administration to assess how student performance has changed over time. Beginning in 2020-21, we have also used this data to track progress towards our Targets and Leading Indicators.

Schools and teachers use data from progress monitoring administrations to better understand student growth and proficiency. If a student is struggling to master a specific skill, teachers can use progress monitoring to assess whether their instruction and interventions are moving the student toward mastery.

More information

The Office of Assessment maintains the assessment calendar and coordinates administration. They can be reached at assessment@philasd.org.