
We use aimswebPlus, a universal screening, benchmarking, and progress-monitoring tool from Pearson, to assess literacy and math proficiency in grades K-5. These assessments help identify students who are meeting grade- and term-level benchmarks as well as those who may need additional support. This post explains aimswebPlus administration and scoring, as well as how we use the data.

This brief explores patterns in the SDP 2019-20 four-year high school graduation rate by sector (District, Charter, and Alternative), Network, Admission type, and student demographics. This brief also includes an analysis of changes in graduation rates for student cohorts with target four-year graduation years of 2018-19 and 2019-20, as well as an examination of potential contributing factors to increased graduation rates from 2018-19 to 2019-20.

The District-Wide Surveys are now open! If you are a teacher, principal, school support staff, parent/guardian, or student in grades 3-12, please take the survey today! Go to philasd.org/dws to get started.

The Office of Evaluation, Research, and Accountability will offer a 60-minute interactive School Profile training session tailored toward school communities and the general public on April 21. The training session will provide an overview how to access the site, search for a school, review both academic and non-academic data, use filters, and compare schools.
In order to help facilitate remote learning during the Covid-19 pandemic, as part of its Continuity of Education plan, the School District of Philadelphia (SDP) distributed Chromebooks to students in grades K-12 in spring 2020. The table below shows the number and percentage of enrolled SDP students in each zip code who have received an SDP Chromebook as of February 9, 2021.
In order to track student progress more frequently than the once-per-year PSSA, SDP has identified within-year “leading indicators” of student performance. We find that, in order to reach the goal of 62% proficiency on the PSSA, there must be an increase in the percentage of students in grades K-3 (both overall and by student subgroup) who score at or above grade-level on aimswebPlus, the Districts’s within-year reading assessment.

This 24-page report compares performance in reading and math assessments for the same set of students over time. The main metric used in this report is the National Percentile Rank (NPR). NPR is a norm-referenced measure that compares student performance to a national sample of students.

The End-of-Year Report presents metrics typically used to calculate the annual School Progress Report (SPR). Due to the COVID-19 pandemic, many data points that are required to calculate the SPR were not administered during 2019-20; therefore, the traditional school-specific SPR scores could not be calculated for the 2019-20 school year. The data included in this…
There are different ways to calculate attendance. The School District of Philadelphia (SDP) reports the percentage of students attending at least 95% of instructional days. Other districts may focus on Average Daily Attendance (ADA). Here’s how they’re different.
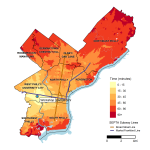
SDP’s School Profiles, which display District-level data as well as school-level information about SPR scores, climate, and standardized test performance, now have an additional functionality. Thanks to a partnership with the Philadelphia Education Research Consortium (PERC), you may now view expected public transit times to each high school’s physical location from anywhere in the city.