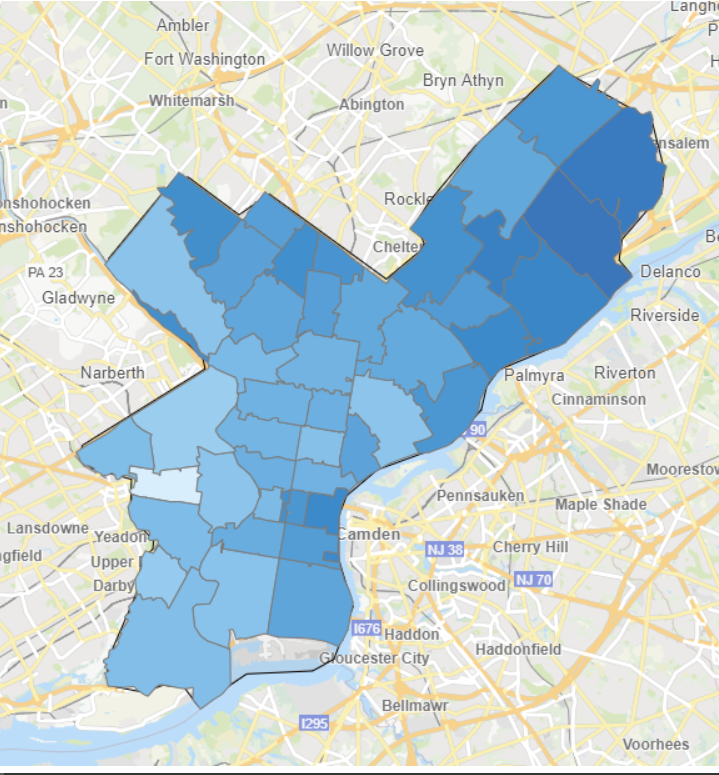
In order to help facilitate remote learning during the Covid-19 pandemic, as part of its Continuity of Education plan, the School District of Philadelphia (SDP) distributed Chromebooks to students in grades K-12 in spring 2020. The table below shows the number and percentage of enrolled SDP students in each zip code who have received an SDP Chromebook as of February 9, 2021. The table does not include students who may have received a Chromebook but who then left the District and returned it. You may view a specific zip code by using the Search function on the top right of the table.
| City | ZIP Code | Number of Students | Number of Students with Chromebook | Percentage of Students with Chromebook |
|---|---|---|---|---|
| Philadelphia | 19149 | 8,837 | 8,525 | 96.5% |
| Philadelphia | 19120 | 7,690 | 7,364 | 95.8% |
| Philadelphia | 19124 | 6,414 | 6,138 | 95.7% |
| Philadelphia | 19111 | 6,236 | 6,049 | 97.0% |
| Philadelphia | 19134 | 5,968 | 5,615 | 94.1% |
| Philadelphia | 19140 | 5,365 | 5,107 | 95.2% |
| Philadelphia | 19143 | 4,696 | 4,444 | 94.6% |
| Philadelphia | 19148 | 4,431 | 4,252 | 96.0% |
| Philadelphia | 19133 | 3,371 | 3,217 | 95.4% |
| Philadelphia | 19115 | 3,272 | 3,135 | 95.8% |
| Philadelphia | 19152 | 3,264 | 3,194 | 97.9% |
| Philadelphia | 19135 | 3,242 | 3,158 | 97.4% |
| Philadelphia | 19139 | 3,214 | 2,914 | 90.7% |
| Philadelphia | 19132 | 3,170 | 3,020 | 95.3% |
| Philadelphia | 19136 | 3,114 | 3,039 | 97.6% |
| Philadelphia | 19142 | 2,906 | 2,723 | 93.7% |
| Philadelphia | 19121 | 2,849 | 2,709 | 95.1% |
| Philadelphia | 19144 | 2,763 | 2,648 | 95.8% |
| Philadelphia | 19116 | 2,748 | 2,659 | 96.8% |
| Philadelphia | 19138 | 2,730 | 2,652 | 97.1% |
| Philadelphia | 19147 | 2,630 | 2,537 | 96.5% |
| Philadelphia | 19145 | 2,400 | 2,262 | 94.3% |
| Philadelphia | 19141 | 2,284 | 2,199 | 96.3% |
| Philadelphia | 19104 | 2,282 | 2,148 | 94.1% |
| Philadelphia | 19154 | 2,193 | 2,153 | 98.2% |
| Philadelphia | 19151 | 1,925 | 1,821 | 94.6% |
| Philadelphia | 19146 | 1,848 | 1,766 | 95.6% |
| Philadelphia | 19131 | 1,831 | 1,712 | 93.5% |
| Philadelphia | 19114 | 1,752 | 1,724 | 98.4% |
| Philadelphia | 19150 | 1,748 | 1,683 | 96.3% |
| Philadelphia | 19119 | 1,713 | 1,647 | 96.1% |
| Philadelphia | 19122 | 1,561 | 1,473 | 94.4% |
| Philadelphia | 19128 | 1,335 | 1,257 | 94.2% |
| Philadelphia | 19125 | 1,261 | 1,211 | 96.0% |
| Philadelphia | 19126 | 1,248 | 1,209 | 96.9% |
| Philadelphia | 19123 | 879 | 837 | 95.2% |
| Philadelphia | 19130 | 853 | 814 | 95.4% |
| Philadelphia | 19137 | 733 | 709 | 96.7% |
| Philadelphia | 19153 | 690 | 652 | 94.5% |
| Philadelphia | 19107 | 576 | 557 | 96.7% |
| Philadelphia | 19129 | 426 | 404 | 94.8% |
| Philadelphia | 19103 | 323 | 306 | 94.7% |
| Philadelphia | 19106 | 192 | 187 | 97.4% |
| Philadelphia | 19118 | 176 | 171 | 97.2% |
| Outside City | Outside City | 157 | 154 | 98.1% |
| Philadelphia | 19127 | 103 | 100 | 97.1% |
| City Unknown | Zip Code Unknown | 41 | 33 | 80.5% |
| Philadelphia | 19102 | 34 | 33 | 97.1% |
| Philadelphia | 19110 | 16 | 14 | 87.5% |
| Philadelphia | Zip Code Unknown | 2 | 2 | 100.0% |
You may also click here to download the table as an Excel file.
The map below uses the same data to show the percentage of enrolled students with a District-provided Chromebook in each zip code. The darker the blue, the higher the percentage of enrolled students with a Chromebook.

% Active Students with a Chromebook

For more information about the District’s Chromebook distribution, click here.
