Posted on December 4, 2023
Categories: Assessment, District Performance

The Pennsylvania Department of Education (PDE) requires Pennsylvania public school students to take two types of standardized assessments: the Pennsylvania System of School Assessment (PSSA) in grades 3-8, and the Keystone exams in grades 8-11 upon completion of specific courses.

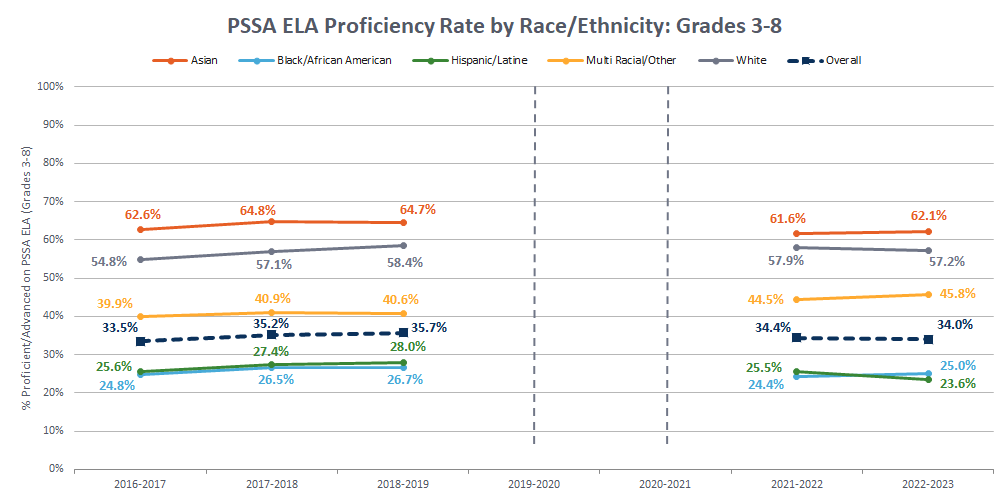
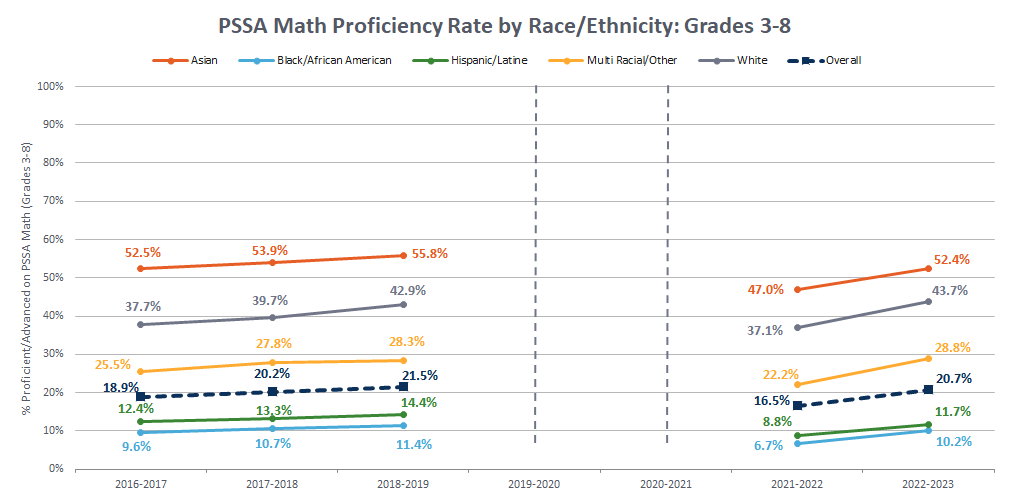
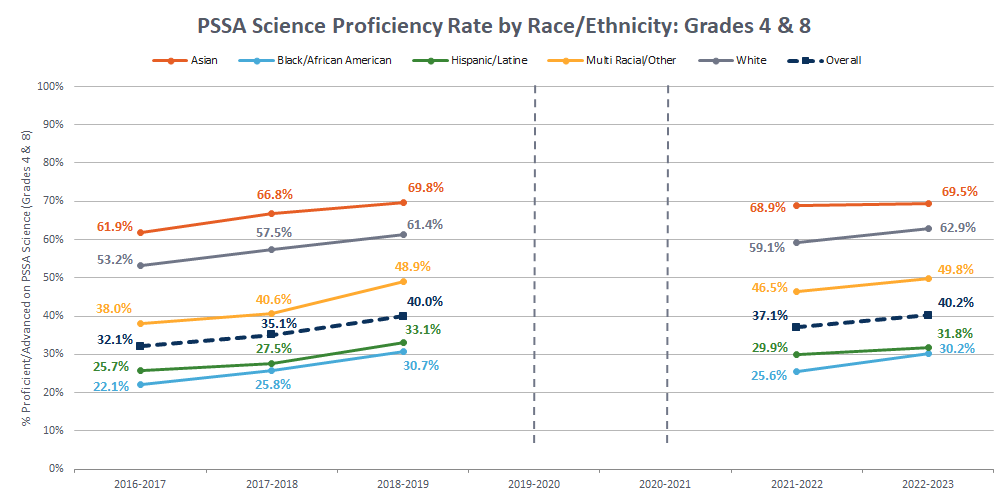
PSSAs are secure, in-person standardized tests, and results are used for accountability purposes. Students in grades 3-8 are tested in English Language Arts (ELA) and Math, and students in grades 4 and 8 are also tested in Science. In spring 2023, 47,635 of 49,844 eligible School District of Philadelphia (SDP) students in grades 3-8 participated in the Pennsylvania System of School Assessment (PSSA) in ELA and 48,380 of 49,785 eligible students in grades 3-8 participated in PSSA Math.1

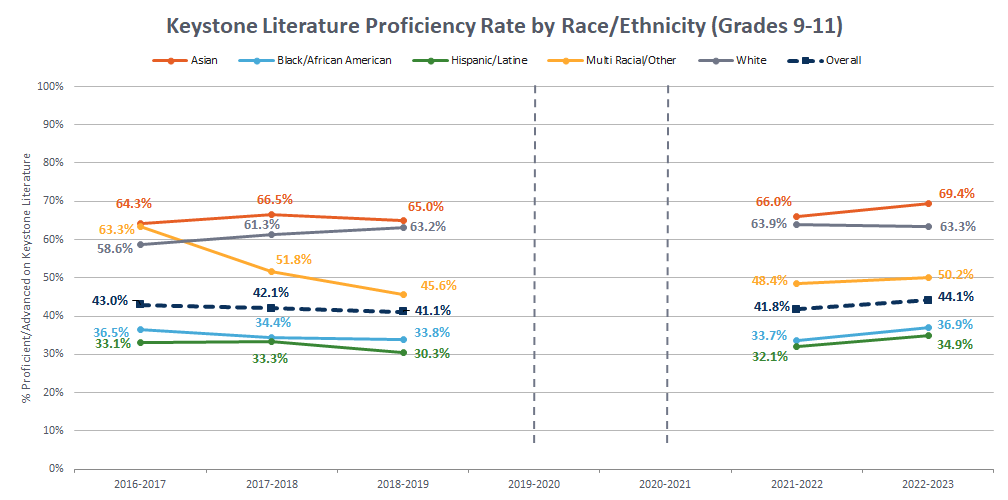
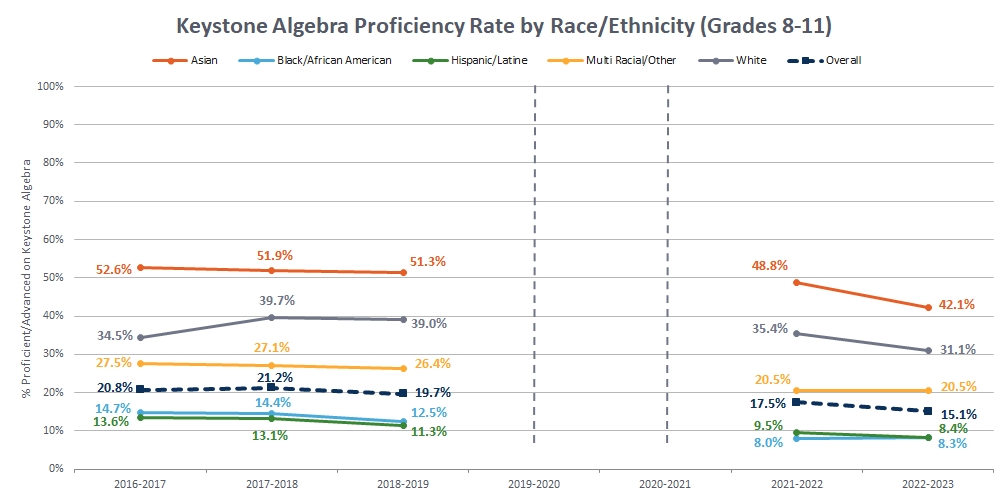
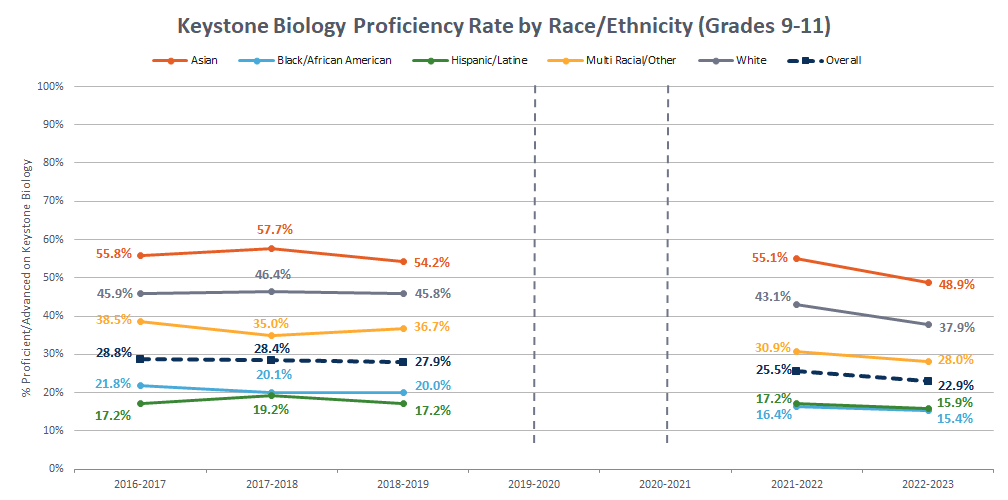
The Keystone exams are capstone tests for core courses in Literature, Algebra I, and Biology, typically taken by students in grades 8-11 during the same year they complete the associated course; however, students can repeat an exam if desired. For accountability and reporting, PDE uses the highest Keystone score received by the end of grade 11, known as “Best by 11th.” In 2023, 9,169 SDP students across grades 9-11 took the Literature Keystone, 16,121 students in grades 8-11 took the Algebra I Keystone, and 10,580 students in grades 9-11 took the Biology Keystone.

On November 8, 2023 PDE published the results of the state standardized tests administered in the 2022-23 school year. Statewide results show mixed results for ELA, with improvement from 2022 for 3rd grade but declines for 7th and 8th grades. PSSA math and science scores improved over 2022 for all grades across Pennsylvania. Although proficiency rates for SDP students are lower than statewide rates, SDP students’ year-over-year results align with the statewide results; we see overall signs of post-pandemic improvement, especially in grades 3-8 math and science.

SDP PSSA Results2

The percentage of District Students in grades 3-8 who were proficient in PSSA ELA remained stable at 34%, and favorably, the percentage of students in grades 3-8 who scored Below Basic in PSSA ELA decreased 1.8 percentage points, from 28.2% in 2021-22 to 26.4% in 2022-23. PSSA ELA proficiency in grades 3-8 remained stable for most racial/ethnic groups with the exception of Hispanic/Latine students and White students, who showed decreases of 1.9 and .7 percentage points respectively. PSSA ELA proficiency for Multiracial/Other students (including American Native and Pacific Islander) students increased 1.3 percentage points; Asian and Black/African American students also had small increases. As has been the historical pattern, the percentage of students scoring proficient on PSSA ELA was highest among Asian students and then White students. Proficiency levels were lowest among Black/African American and Hispanic/Latine students.

The District saw the highest year-over-year increase since 2014-15 in the percentage of grades 3-8 students who were proficient in PSSA Math, with an increase of 4.2 percentage points, from 16.5% proficiency in 2021-22 to 20.7% in 2022-23. In addition, the percentage of students who scored Below Basic in PSSA Math decreased by 4.9 points, from 61.7% in 2021-22 to 56.8% in 2022-23. There is much room for improvement in Math performance; however, 2022-23 PSSA results show that the District is on the right track.

The improvement in proficiency rates for PSSA Math was reflected across all racial/ethnic groups: PSSA Math proficiency for Asian, White, and Multi Racial/Other students each increased by more than 5 percentage points. PSSA Math proficiency continued to be lower for Black/African American and Hispanic/Latine students, even though each group saw an increase of 3 percentage points in PSSA Math proficiency.

The percentage of District students in grades 4 and 8 who were proficient in Science increased by 3.1 points, from 37.1% in 2021-22 to 40.5% in 2022-23. This improvement was reflected for all racial/ethnic groups, especially for Black/African American students, whose proficiency increased at a higher rate, rising 4.6 percentage points (25.6% in 2021-22 to 30.2% in 2022-23). District students of all racial/ethnic groups had been showing a rising trend in PSSA Science proficiency since 2016-17 before the pandemic disruption; we see tentative evidence that District students are returning to this trend of improvement.

SDP Keystone Results

SDP’s Keystone results are not directly comparable to PDE’s results because PDE reports only the “Best by 11th” scores for grade 11 students, while the SDP scores shown here include all students in grades 8-11 who took the 2022-23 Keystone exams.

For all SDP students in grades 9-11 who took the Literature Keystone in 2023, 44.1% scored proficient or above, an increase of 2.3 percentage points from 2022. All student groups except for White students showed improvements in the Literature Keystone; the decline in proficiency for White students was less than 1 percentage point.

The percentage of students in grades 8-113 who scored proficient or advanced on the Algebra I Keystone declined by 2.4 points, from 17.5% to 15.1%. The percentage of Asian students who scored proficient declined the most, falling 6.6 points, from 48.8% in 2021-22 to 42.1% in 2022-23. The decline for White students was 4.3 percentage points, and for Hispanic/Latine students it was 1.1 percentage points.

The percentage of grades 9-11 students who scored proficient in the Biology Keystone declined by almost 3 points, from 25.5% in 2021-22 to 22.9% in 2022-23. Similar to the Algebra Keystone results, the decline was the largest for Asian students (6.2 percentage points), followed by White students (5.2 percentage points).

A number of forthcoming publications will examine 2022-23 PSSA and Keystone data in more depth, including:
  • PSSA Performance Trends from 2018-19 to 2022-23
  • Keystone Performance Trends from 2018-19 to 2022-23
  • PSSA/PASA Performance by Primary Disability
For additional data on SDP PSSA and Keystone outcomes and trends, see our 2021-22 PSSA and Keystone blog post, our PSSA report library and Keystone report library, or our Open Data website.

1 This number includes students who took the Pennsylvania Alternate System of Assessments (PASA). The PASA is designed for students with the most significant cognitive disabilities who are not able to participate in the PSSA. Some PDE-reported numbers for SDP include only PSSA results and do not include PASA results.

The District proficiency rates reported here and elsewhere in SDP communications might differ from the SDP rates published by PDE. This is because the District uses the number of students who were tested and attributable to the District (or school) as the denominator. However, if the District (or school) participation is below 95%, PDE uses the number of students who needed to be tested to meet the 95% participation rate as the demonimator. PDE’s method effectively penalizes the District (or school) if participation was lower than 95%.

Algebra I is typically the only Keystone exam taken by students in grade 8.