Strategic Plan
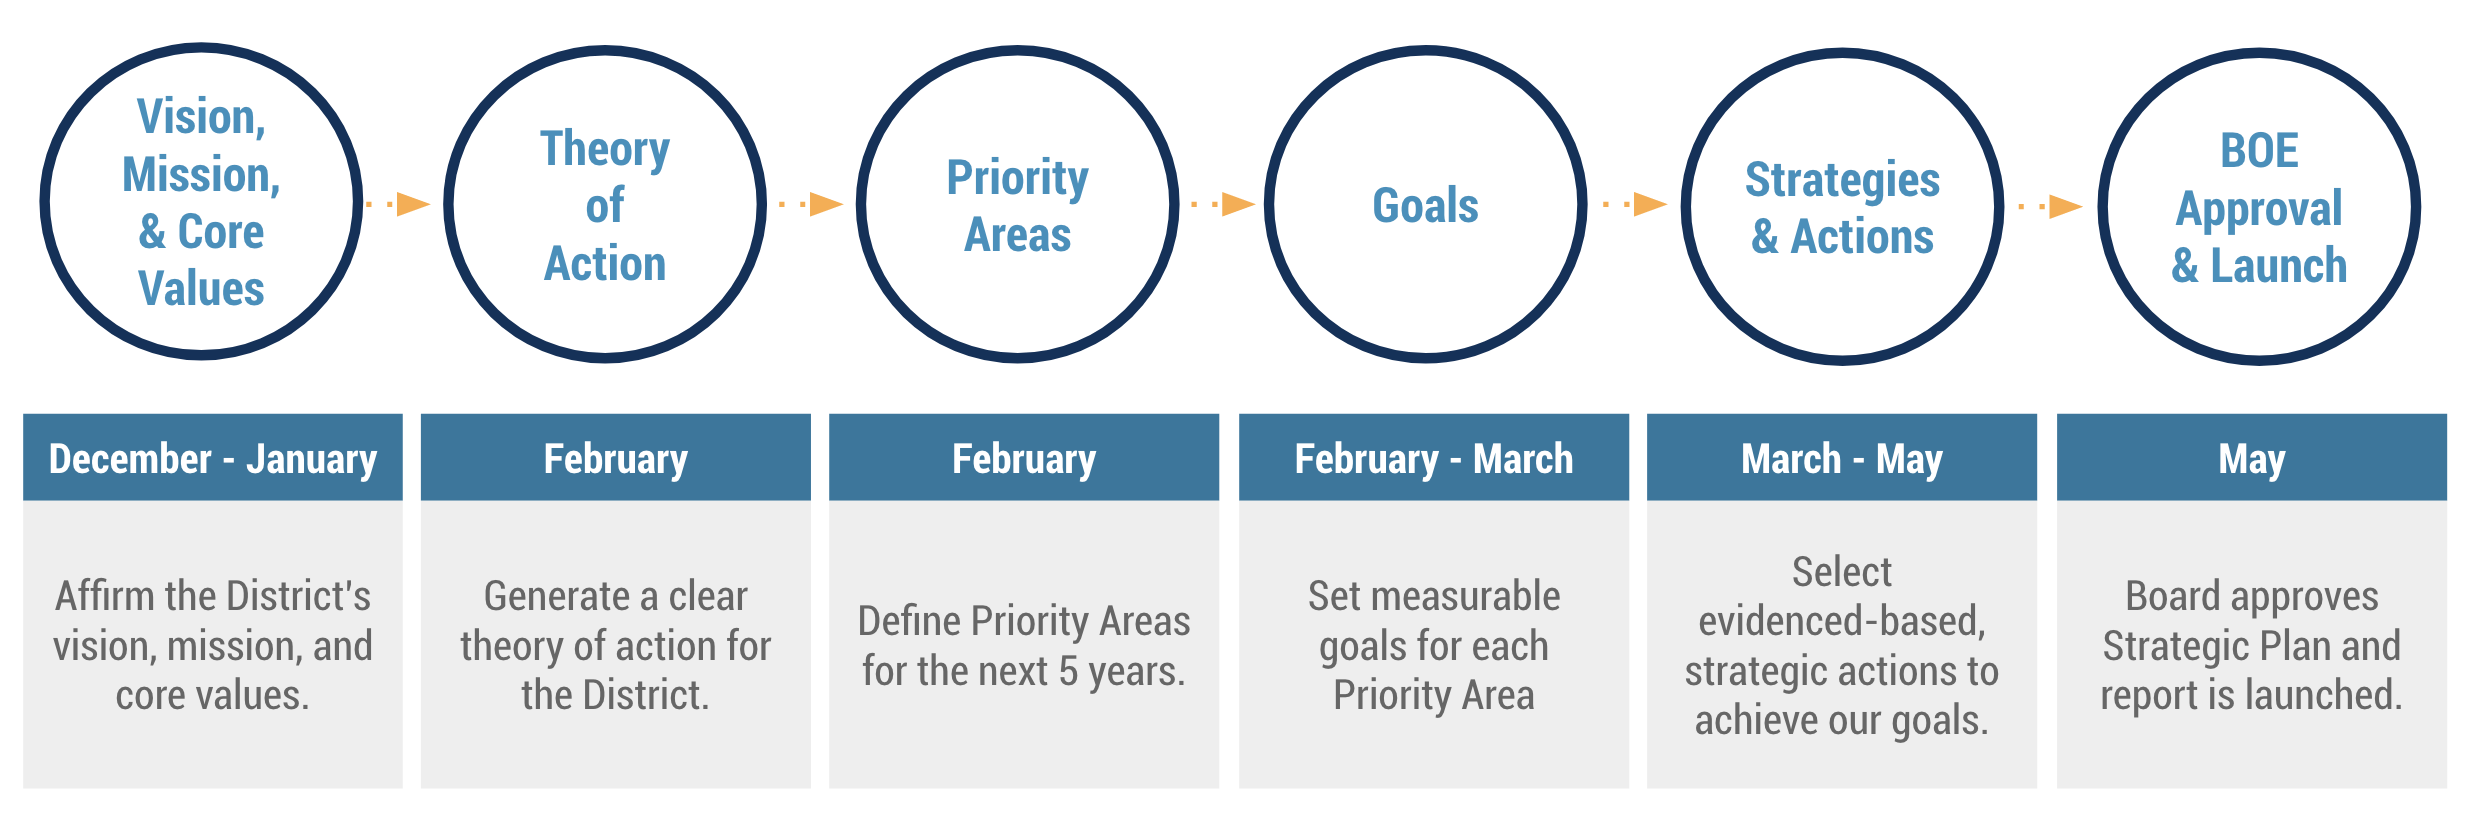
The Strategic Planning Process kicked off in December 2022 and will conclude with the approval of the 5-year Strategic Plan at the May Board of Education Public Meeting. This process includes several key phases to develop the components of the plan and allow for feedback and insights from the Advisory Groups.
Stages of the Strategic Planning Process
Mission, Vision, and Core Values
During the first stage of the Strategic Planning process, the District’s core values, vision, and mission were refined. These elements will serve as the foundation for the Strategic Plan and our work going forward. Parents, students, community members, and staff were asked to provide feedback as these elements were updated. All members of the community were invited to complete a Mission, Vision, and Values survey so that the revisions reflect the viewpoints of the entire District. In addition, all 8 Strategic Planning Advisory Groups met to discuss their insights and feedback on the mission, vision, and values. Both the survey participants and Advisory Group members reviewed a range of options and examples to elevate themes and ideas that were the most meaningful to them. Below is a summary of the individuals and Advisory Groups that provided feedback.
District-Wide Survey Participants
984 individuals completed the survey
- 68% Parents/Guardians
- 14% School-based staff
- 7% Students
- 7% Central Office staff
- 3% Community members
Advisory Groups
- Central Office Staff
- Community Leaders
- Parents/Guardians
- School Leaders
- School Support Staff
- Superintendent’s Student Advisory Council
- Teachers
- Union Leaders and Representatives
Revised Values, Vision, and Mission
Based on the survey feedback and the insights from the Strategic Plan Advisory Groups, Steering Committee, Leadership Team, and the Board of Education, we have completed the revision process of the District’s mission, vision, and core values. We worked to incorporate ideas and themes that were frequently highlighted across multiple groups and perspectives. With such a wide range of feedback, not every insight was elevated, but efforts were made to create a mission, vision, and core values that is as inclusive of our shared ideas as possible. We hope that these will serve as a strong foundation for our work going forward and thank everyone for their time and effort in this revision process. Below are our updated core values, vision, and mission for the School District of Philadelphia.
Core Values
- Safety is imperative to our work.
- Equity requires needs-based distribution of resources.
- Collaboration involves gathering and honoring community voices.
- Joy inspires active engagement and belonging.
- Trust is built through good communication, public transparency, and holding ourselves accountable.
- Ambition requires us to work with urgency to accelerate student achievement.
Vision
To prepare students to imagine and realize any future they desire.
Mission Statement
All sectors of public education in Philadelphia will work with urgency to provide every student with the opportunity to achieve positive life outcomes in partnership with diverse families, educators, and community members who are valued and respected.
Summary of Feedback
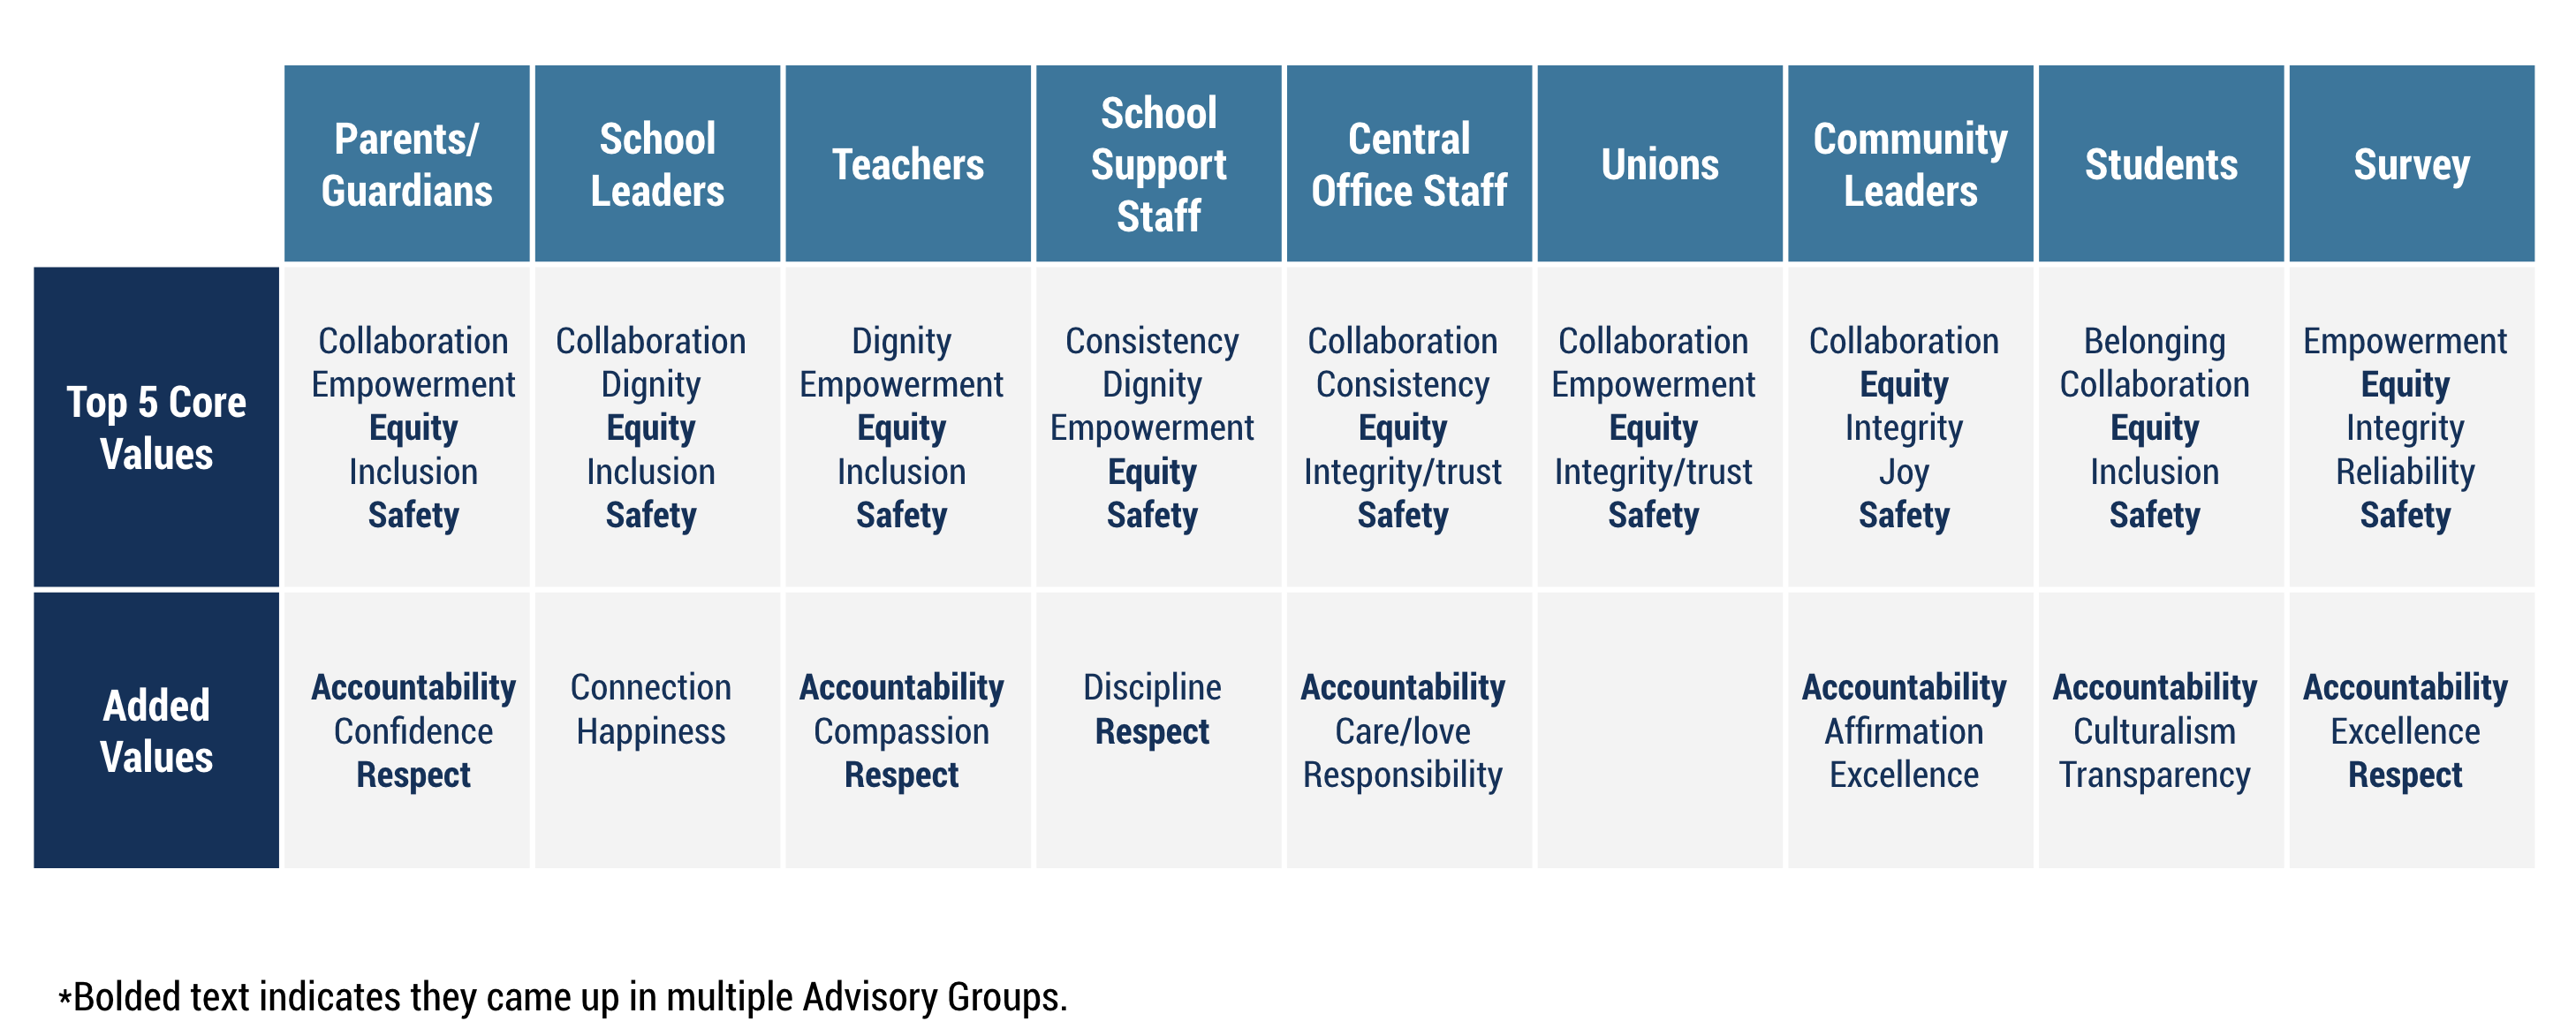
The results of the Mission, Vision, and Values survey and the feedback from the Advisory Groups were analyzed for common themes and insights. There were many places of agreement, while in other areas we heard differing opinions. For the core values, survey participants and Advisory Group members were asked to identify which listed values resonated most with them and if there were any missing. Here is a summary by group of the values that were elevated and suggested.
Core Value Themes By Participant Group
Click here to view image larger
In reviewing examples of vision and mission statements, Advisory Group members and survey participants shared which ideas, words, and phrases resonated with them, as well as general feedback to keep in mind.
Vision Feedback Themes
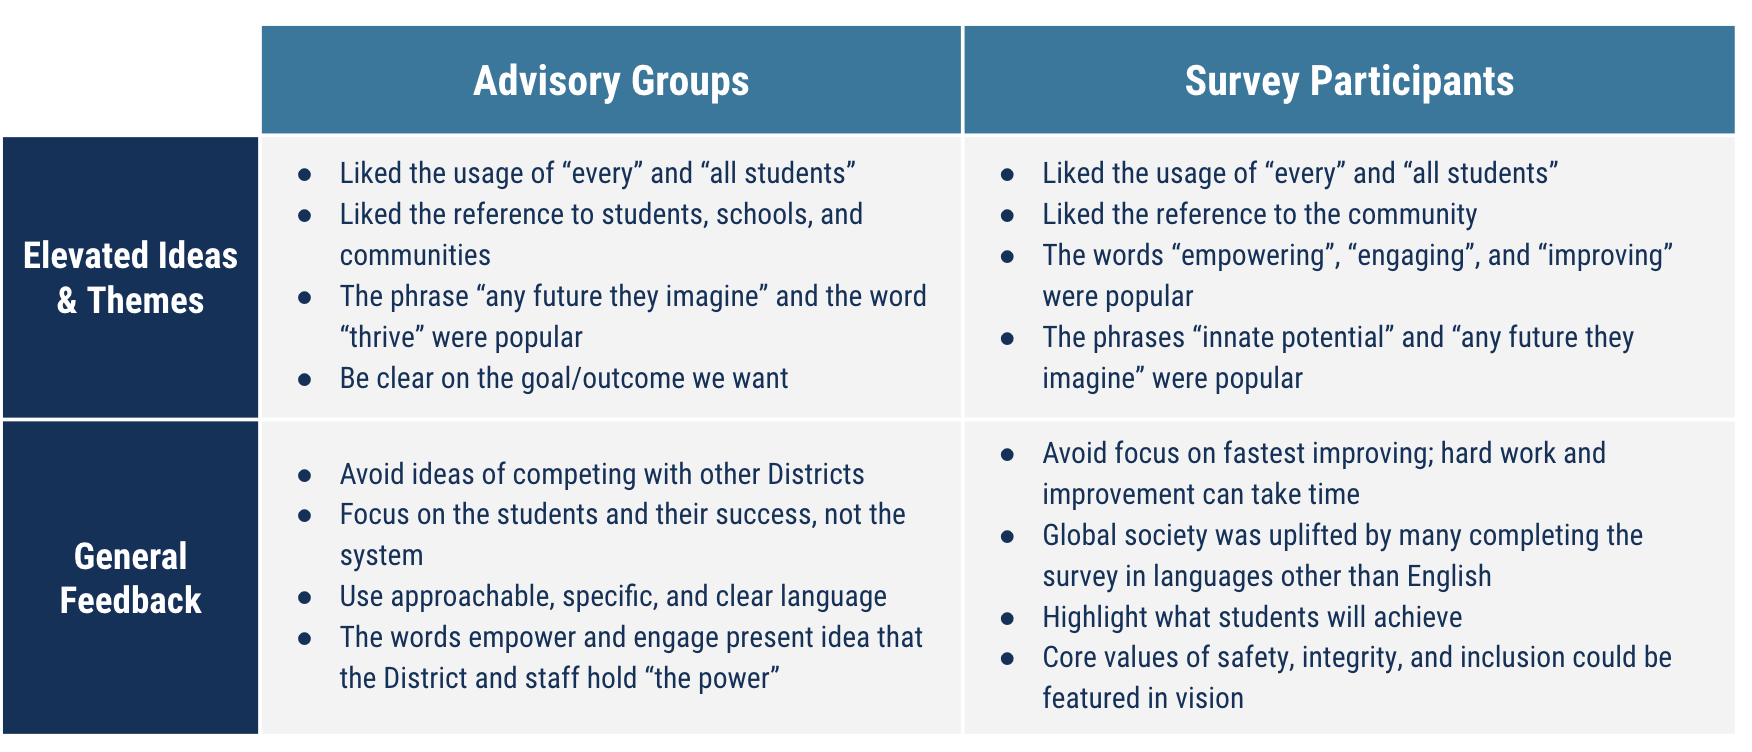
Click here to view image larger
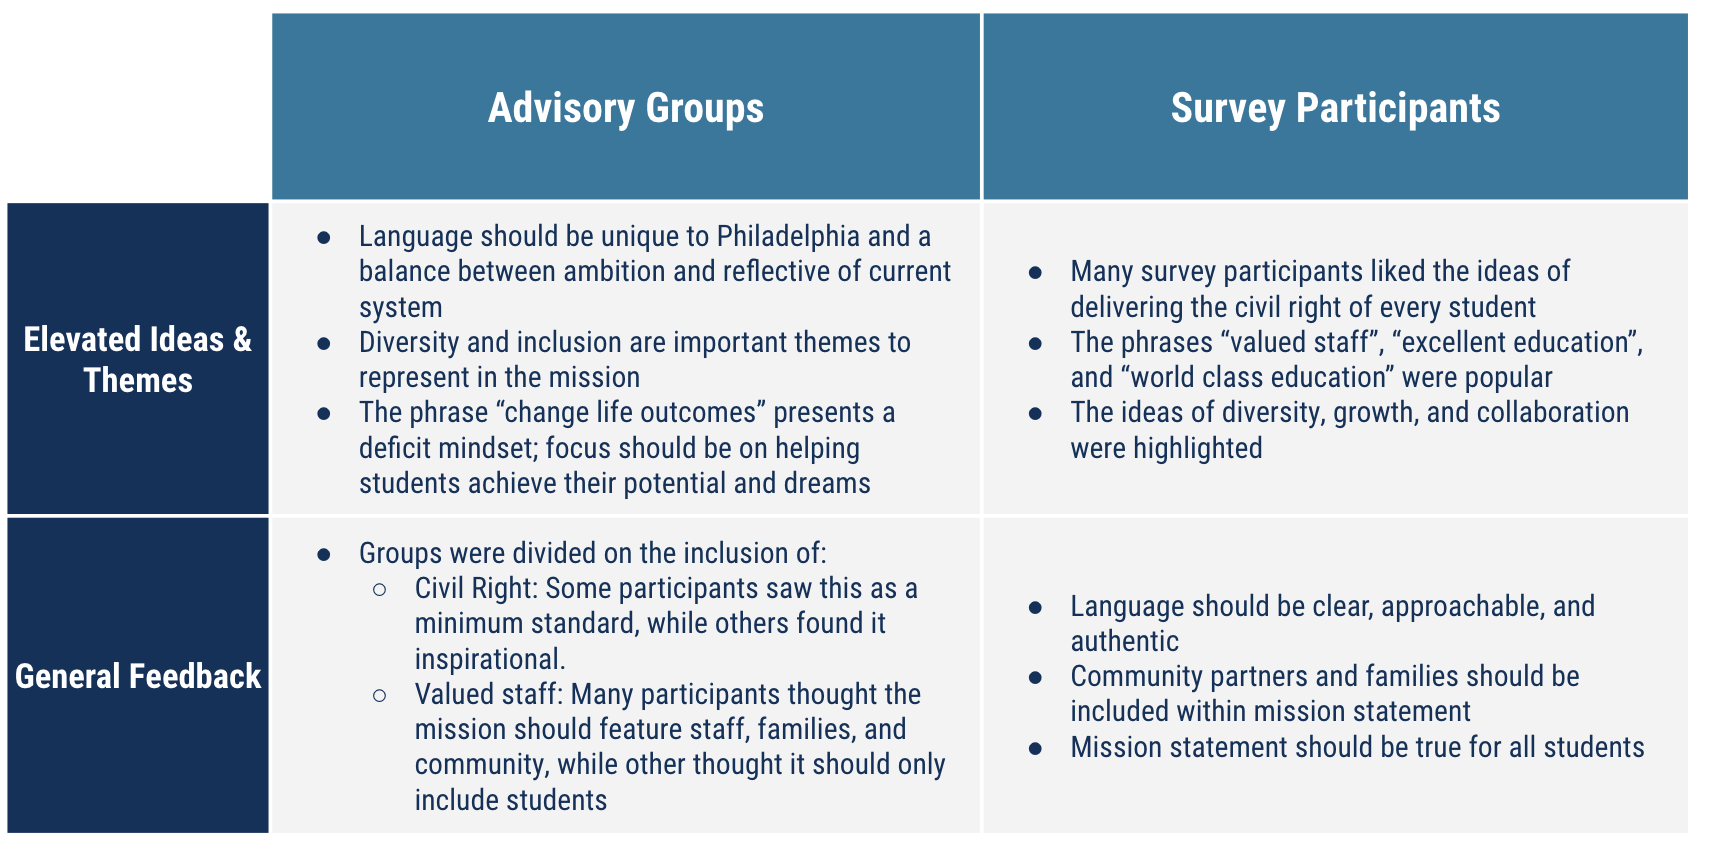
Mission Feedback Themes
Theory of Action
As the next Stage in the Strategic Plan, the Advisory Groups, Steering Committee, and Leadership Team provided feedback and insights to generate a theory of action. The Transition Team Report noted that the District lacked a clearly outlined theory of action on how it expects to raise student achievement. This newly created theory of action documents how we as a District plan to improve and accelerate progress towards our goals.
When we focus on…
Then we will reach the Goals and Guardrails and transform learning and life outcomes for all students.

 Priority Area 1
Improve safety and well-being (physical, social-emotional, and environmental)
Safe environments are critical for our students and staff to learn and grow. This includes physical, social-emotional, and environmental safety. To make strides in these areas, our approach must be collaborative – including the District, the City of Philadelphia, and our partners throughout the community. As these Strategic Actions are implemented, students, staff, and families will see improvements in physical learning spaces, more consistent access to mental and behavioral health services, greater social-emotional supports, and an increased sense of safety in school buildings.
Strategic Actions
1.1 Establish a facilities master plan project team, including internal and external stakeholders, to identify a process and investments needed to significantly improve academic achievement and to achieve Guardrails 1 and 2.
1.2 Improve management of environmental conditions and hazards by hiring an administrator and investing in a modern data management system.
Why is this urgent?
Our students’ perceptions of building conditions are related to their feelings of belonging, safety, and trust at their schools. During Listening and Learning sessions, students, school staff, families, and community members shared serious concerns about lead and asbestos remediation, lack of air conditioning, and needed upgrades to electrical and security systems in school buildings. A 2017 report estimated the replacement value to facilities across the district to be $7.8 billion dollars.
Why these strategies?
Spatial configurations impact students’ and teachers’ ability to perform. To maximize learning, students need clean air, good light, and a quiet, comfortable, and safe learning environment. High quality teachers tend to transfer to schools with better facilities when given the opportunity. Additionally, a recent study found that school facility improvements in Los Angeles had a positive impact on test scores and attendance, yielding a strong return-on-investment of $1.62 for every $1 spent.
Aligns with: All Goals, Guardrails 1 and 2; Transition Team Recommendations
1.3 Replace all analog security cameras at 150 schools.
1.4 Pilot and evaluate Opengate weapons detection technology for stand-alone middle schools.
Why is this urgent?
Philadelphians believe that Dr. Watlington’s first priority as Superintendent should be school climate and safety. In 2022, Philadelphia recorded over 15,000 violent crime offenses, including over 4,000 shooting incidences.District stakeholders feel that, at the most basic level, school building doors, locks, and cameras are essential for security, yet they are not always functioning properly. On the annual survey, only 55% of students reported that they feel safe in their school hallways.
Why these strategies?
Safe schools are places where students are safe from violence, bullying and harassment, and the influence of substance abuse. Decades of research have shown that when students do not feel safe in school, they suffer socio-emotionally, behaviorally, and academically. Internal research shows that teacher retention is linked to teacher perceptions of school climate and safety. Working cameras outside of the school building have been shown to improve students’ perceptions of safety. The Opengate technology identifies threats to safety by detecting specific types of weapons, such as assault rifles (it is not designed to detect lesser threats, such as knives).
Aligns with: Guardrail 1
1.5 Expand the Safe Path Program in partnership with foundations and city and state funders.
Why is this urgent?
On the annual survey, 51% of students indicated that they have safety concerns going to or from school. Over 60% of students said they do not feel safe in the neighborhood surrounding their schools. Two-thirds of leaders said that neighborhood crime/safety is a challenge to student learning. During Listening and Learning sessions, students noted that neighborhood crime/safety impacts their ability to attend school.
Why this strategy?
Research on the Safe Passage Program in Chicago found that it had a significant impact on reducing crime near schools. It is an important component of addressing stakeholder concerns, including students having to travel far distances and through unsafe conditions to get to their school, which is a barrier to regular, on-time attendance.
Aligns with: Guardrail 1; Transition Team Recommendations
1.6 Develop a bridge program for students transitioning back from placement at Philadelphia Juvenile Justice Services Center, Pennypack House, and other long-term placements.
Why is this urgent?
Over the past two school years, approximately 1,000 students transitioned back to a general education setting from long-term facilities, dependent placements, or mental health hospitals. These students are more likely to have experienced trauma and neglect and more than twice as likely to drop out of school than students who have not been sent to an alternative setting. However, when formerly incarcerated youth return to and attend school regularly, they reduce their chances of reincarceration and dropping out. Themes from Listening and Learning sessions with school leaders indicate a need to improve the coordination of services for students returning from placement, including collaboratively identifying the school that can best meet the needs and interests of each student and ensuring that every student is fully supported in adapting to and thriving in the new environment. School leaders also noted that transitional supports often do not last long enough to meet the extensive needs of returning students. Ideally, school leaders would like students to have the opportunity to participate in interim programming aimed at supporting their transition back to the general education setting.
Why this strategy?
Students returning from long-term placement benefit from high levels of adult support and service coordination, which schools do not always have the capacity to provide. Supportive interventions, such as mentoring and restorative practices, can have a positive effect on attitudes about school for students who are transitioning back from a long-term placement. For students with intensive needs, educational programs that can “bridge” the gap between a long-term placement and a traditional learning environment can focus on providing these supports in order to fully prepare the learner to return to a traditional school setting.
Aligns with: Goal 4 and Guardrail 1
1.7 Identify, audit, and improve school climate programs.
Why is this urgent?
National research strongly links school climate with student attendance, academic achievement, persistence to graduation, and teacher attendance and retention. In the District, when accounting for school-level student demographics, responses to climate questions on the student, parent/guardian, and teacher surveys were all significantly predictive of school-level math and reading proficiency. Fewer than half of student respondents on the annual survey indicated that they consistently feel like they belong at school (36%); feel welcome at school (45%); and enjoy being at school (31%). This is particularly concerning given that there is a strong link between academic achievement and how students feel in school. Evidence-based social-emotional and climate programs can significantly improve overall climate and students’ positive feelings about school; however, implementation data reveals that many schools struggle to implement these programs with fidelity.
Why this strategy?
The District currently supports three evidence-based school wide social-emotional and restorative climate approaches: Culturally Responsive Relevant Positive Behavioral Interventions and Supports (CR-PBIS); Schoolwide Social-Emotional Learning (SEL), and Relationships First (RF). Schools select their schoolwide approaches during the school planning process. When PBIS is implemented with fidelity, there are positive outcomes for students, such as reductions in suspensions and truancy, and gains in reading and math achievement. Schoolwide SEL practices in schools provide short- and long-term benefits to students’ well-being, prosocial behaviors, and avoidance of high-risk behaviors (e.g. substance abuse). These impacts persist regardless of parental income or race. The Relationships First program, which was modeled after Oakland Unified School District’s restorative justice program, is associated in multiple studies with decreases in suspensions, expulsions, and referrals for violent offenses, and with large gains in academic achievement. Strong implementation of these programs can be expected to improve outcomes in all of these areas.
Aligns with: Guardrails 1 and 4
1.8 Identify, audit, and improve mental and behavioral health services in partnership with the City of Philadelphia.
Why is this urgent?
Exposure to chronic childhood trauma significantly increases the risk of developing mental health disorders, which in turn negatively impact academic achievement. Results of the Philadelphia Youth Risk Behavior Survey (YRBS) show that over 39% of District students have experienced traumatic events, including witnessing physical abuse in their home and violence in their community. Nearly all school leaders (91%) identified mental health as a significant challenge in their school, according to the annual survey. In addition, during Listening and Learning sessions, students, school staff, families, and community members shared that the District has insufficient staff to meet students’ mental health and social-emotional needs, particularly in the midst of Philadelphia’s gun violence epidemic. Schools need more trauma-informed approaches, more counselors, and more caring adults to listen and understand students’ experiences.
Why this strategy?
The Institute of Education Sciences has identified several trauma-informed mental and behavioral health services that have promising evidence when implemented with fidelity. They can improve outcomes for students, including the reduction in trauma- related symptoms. Several of these evidence-based programs are currently being implemented by the District, but we have yet to evaluate implementation or effectiveness.
Aligns with: Guardrails 1 and 4
1.9 Recruit and retain certified school nurses for all schools to provide in-person or telehealth services depending on student need.
Why is this urgent?
Chronic health conditions are a barrier to learning for many District students. On the Philadelphia Youth Risk Behavior Survey (YRBS), 25% of high school students reported being told by a doctor or nurse that they had asthma, and 34% reported that their physical health was not good. Echoing this self-reported data, in the annual survey, 40% of school leaders reported that chronic illness was a great or moderate challenge to student learning. Recognizing the severity of health-related barriers to learning, The Children’s Hospital of Philadelphia (CHOP) PolicyLab recommended that the District implement more optimal school nurse staffing models and supports to adequately respond to the volume and complexity of our students’ health needs. Over the past three years, the District has had a year-end nurse vacancy rate of between 3% and 6%.
Why this strategy?
The presence of a full-time school nurse is associated with reduced absenteeism and missed class time, particularly for students with asthma, students living in poverty, and African-American students. Emerging research shows that when in-person nurses are not available, telehealth services can be a valuable resource for expanding access to health services, which can result in better management of chronic conditions, improved education, reduced travel time and expenses, and fewer absences from school and work.
Aligns with: Guardrails 1 and 4; Transition Team Recommendations
1.10 Implement Breakfast After the Bell at all schools and offer sufficient, healthy, and appetizing food during appropriate meal times to all students.
Why is this urgent?
Food-insecure children are more likely to have lower grades and test scores and to experience developmental delays, social-emotional and behavioral problems, and suspensions. District families report double the rate of food insecurity compared to state and national averages. On the annual survey, 41% of principals identified food insecurity as a great or moderate challenge to student learning. During Listening and Learning sessions, students, school staff, families, and community members shared that hunger is a challenge to student learning, and that not all District students have equitable access to healthy and appetizing school food. Students also noted that access to appetizing food promotes regular student attendance. On the annual survey, 48% of students disagreed that their school lunch tastes good and 44% disagreed that they got enough food to fill them up. Although all schools serve breakfast and lunch at no cost to families, participation varies due to meal timing and student perceptions of food quality and taste. District research found that students encounter barriers to getting to school early enough to access free school breakfast prior to the start of school. Additionally, lunch schedules vary from as early as 9:30am to as late as 1:30pm. When breakfast and lunch intervals are not aligned well, this can mean that students are hungry while in class.
Why this strategy?
There are positive associations between school meal programs, including Breakfast After the Bell, and improved diet quality and food security, increased academic performance and attendance (particularly for food-insecure or malnourished students). District research found increased breakfast participation rates in schools with Breakfast After the Bell programs. Additionally, principals and school staff believe that offering popular items, such as fresh fruit and hot breakfast foods (e.g., egg sandwiches) increases breakfast participation. Ensuring that students have adequate time to eat at appropriate times during the school day means they have the energy needed to focus on learning.
Aligns with: Guardrails 1 and 4
1.11 Implement recess supervised by trained staff and aligned to national best practices for all K-8 students.
Supporting Research
1. Race equity and inclusion action guide: 7 steps to advance and embed race equity and inclusion within your organization. (2014). Annie E. Casey Foundation. https://assets.aecf.org/m/resourcedoc/AECF_EmbracingEquity7Steps-2014.pdf#page=4.
2. Guardrail 1: Every school will be a safe, welcoming, and healthy place where our students, staff, and community want to be and learn each day. This means that our schools will be: 1) environmentally safe and clean; and 2) spaces with inclusive climates that provide students with access to robust social, emotional, and mental health supports.
3. McCrossan, E., Pylvainen, H. (2023). Summary of high-level findings from cognitive interview focus groups with students about District-Wide Survey questions related to Guardrail 1: Safe and Supportive Environments. School District of Philadelphia. Internal memo.
4. Reitano, A., McCrossan, E., Fornaro, E., Pylvainen, H., Lesnick, J., and Wolford, T. (2023). Highlights of key findings from the Superintendent’s Listening and Learning Tour. School District of Philadelphia. https://www.philasd.org/ research/2023/01/23/highlights-of-key-findings-from-the-superintendents-listening-and-learning-tour/.
5. Parsons Environment & Infrastructure Group Inc. (2017). School District of Philadelphia Facility Condition Assessment. Parsons Corporation. https://www.philasd.org/capitalprograms/wp-content/uploads/sites/ 18/2017/06/2015-FCA- Final-Report-1.pdf.
6. Schneider, M. (2002). Do school facilities affect academic outcomes? (ED470979). US Department of Education Review. https://files.eric.ed.gov/fulltext/ED470979.pdf.
7. Feng, L., & Sass, T. R. (2017). Teacher quality and teacher mobility. Education Finance and Policy, 12(3), 396–418. https://doi.org/10.1162/EDFP_a_00214.
8. Feng, L. (2018). Hire today, gone tomorrow: New teacher classroom assignments and teacher mobility. Education Finance and Policy, 5(3), 278–316.
9. Lafortune, J., & Schönholzer, D. (2022). The impact of school facility investments on students and homeowners: Evidence from Los Angeles. American Economic Journal: Applied Economics, 14(3), 254–289.
10. Reitano, A., McCrossan, E., Fornaro, E., Pylvainen, H., Lesnick, J., and Wolford, T. (2023). Highlights of key findings from the Superintendent’s Listening and Learning Tour. School District of Philadelphia. https://www.philasd.org/ research/2023/01/23/highlights-of-key-findings-from-the-superintendents-listening-and-learning-tour/.
11. Philadelphia Police Department. (n.d.). Crime Maps & Stats. https://www.phillypolice.com/crime-maps-stats/.
12. Reitano, A., McCrossan, E., Fornaro, E., Pylvainen, H., Lesnick, J., and Wolford, T. (2023). Highlights of key findings from the Superintendent’s Listening and Learning Tour. School District of Philadelphia. https://www.philasd.org/ research/2023/01/23/highlights-of-key-findings-from-the-superintendents-listening-and-learning-tour/.
13. Internal data, Qlik Philly School Experience Survey Application, Accessed May, 2023.
14. National Center on Safe Supportive Learning Environments. (n.d.). Safety. School Climate Improvement: Safety. https://safesupportivelearning.ed.gov/topic-research/safety.
15. Ripski, M. B., & Gregory, A. (2009). Unfair, unsafe, and unwelcome: Do high school students’ perceptions of unfairness, hostility, and victimization in school predict engagement and achievement? Journal of School Violence, 8(4), 355–375. https://doi.org/10.1080/15388220903132755.
16. Bradshaw, C. P., Cohen, J., Espelage, D. L., & Nation, M. (2021). Addressing school safety through comprehensive school climate approaches. School Psychology Review, 50(2-3), 221–236.
17. Bryk, A., Sebring, P. B., Allensworth, E., Easton, J. Q., & Luppescu, S. (2010). Organizing schools for improvement: Lessons from Chicago. The University of Chicago Press.
18. Temple, J. & Reitano, A. (2020). The relationship between teachers’ perceptions of school climate and teacher retention. School District of Philadelphia, Office of Research and Evaluation. https://www.philasd.org/research/ wp-content/uploads/sites/90/2020/07/Teacher-Perceptions-of-Climate-and-Retention-Research-Brief-July-2020.pdf.
19. Johnson, S. L., Bottiani, J., Waasdorp, T. E., & Bradshaw, C. P. (2018). Surveillance or safekeeping? How school security officers and camera presence influence students’ perceptions of safety, equity, and support. Journal of Adolescent Health, 63(6), 732-738.
20. CEIA Opengate revolutionary new weapons detection system (n.d.). https://yatesprotect.com/products/ ceia-opengate%E2%84%A2-a-revolutionary-new-weapons-detection-system.
21. How Opengate can improve your campus weapons screening process (n.d.) Campus Safety Magazine.
22. Internal data, Qlik Philly School Experience Survey Application, Accessed May, 2023.
23. Listening and Learning: Teacher attendance, student attendance, and dropout prevention. Spring 2023. Internal document.
24. Gonzalez, R., & Komisarow, S. (2020). Community monitoring and crime: Evidence from Chicago’s Safe Passage Program. Journal of Public Economics, 191. https://doi.org/10.1016/j.jpubeco.2020.104250.
25. Listening and Learning: Teacher attendance, student attendance, and dropout prevention. Spring 2023. Internal Document.
26. Internal data, Office of Student Rights and Responsibilities, provided May, 2023.
27. Pace, S. (2018). From correctional education to reentry: How formerly incarcerated youth can achieve better educational outcomes. Texas Journal on Civil Liberties & Civil Rights, 23(2), 127–143.
28. Kelchner, V.P., Evans, K., Brendell, K., Allen, D., Miller, C., & Cooper-Haber, K. (2017). The effect of a school-based transitional support intervention program on alternative school youth’s attitudes and behaviors. The Professional Counselor 7(2), 169–184.https://tpcjournal.nbcc.org/wp-content/uploads/2017/07/169-184-Kelchner.pdf.
29. Blomberg, T.G., Bales, W.D., Mann, K., Piquero, A.R., & Berk, R.A. (2011). Incarceration, education and transition from delinquency. Journal of Criminal Justice, 39(4), 355–365. https://doi.org/10.1016/j.jcrimjus.2011.04.003.
30. Listening and Learning: Teacher attendance, student attendance, and dropout prevention. Spring 2023. Internal document.
31. Listening and Learning: Teacher attendance, student attendance, and dropout prevention. Spring 2023. Internal document.
32. Kelchner, V.P., Evans, K., Brendell, K., Allen, D., Miller, C., & Cooper-Haber, K. (2017). The effect of a school-based transitional support intervention program on alternative school youth’s attitudes and behaviors. The Professional Counselor 7(2), 169–184. https://doi:10.15241/vpk.7.2.169.
33. Van Eck, K., Johnson, S.R., Bettencourt, A., & Johnson, S.L. (2017). How school climate relates to chronic absence: A multi–level latent profile analysis. Journal of School Psychology, 61, 89–102. https://doi.org/10.1016/j.jsp.2016.10.001.
34. Davis, J. R. & Warner, N. (2015). Schools matter: The positive relationship between New York City high schools’ student academic progress and school climate. Urban Education, 53(8), 959–980. https://doi.org/10.1177/0042085915613544.
35. Eugene, D. R. (2020). A multilevel model for examining perceptions of school climate, socioeconomic status, and academic achievement for secondary school students. Journal of Education for Students Placed at Risk, 25(1), 79–99. https://doi.org/10.1080/10824669.2019.1670067.
36. Kraft, M. A., & Falken, G. T. (2020). Why school climate matters for teachers and students (EJ1257758). State Boards of Education report. https://files.eric.ed.gov/fulltext/EJ1257758.pdf.
37. Papay, J. & Kraft, M. A. (2017). Developing workplaces where teachers stay, improve, and succeed: Recent evidence on the importance of school climate for teacher success. Teaching in Context: How Social Aspects of School and School Systems Shape Teachers’ Development & Effectiveness, 15–35. Harvard Education Press.
38. Reitano, A., Park, J. & Wills, T. (2018). School climate and PSSA Performance in Philadelphia, 2016-2017. School District of Philadelphia, Office of Research and Evaluation. https://www.philasd.org/research/wp-content/uploads/ sites/90/2018/03/DWS-Climate-and-PSSA-Performance-Focus-Brief-March-2018.pdf.
39. Internal Data, Qlik Philly School Experience Survey Application, Accessed May, 2023.
40. Schlesinger, M., Karakus, M., Park, J. (2021). School-wide Positive Behavioral Interventions & Supports (PBIS): Five-year school-wide outcome. School District of Philadelphia. https://www.philasd.org/research/2021/09/14/ school-wide-positive-behavioral-interventions-and-supports-pbis-five-year-school-wide-outcome-trends/.
41. Lee, A., & Gage, N. A. (2020). Updating and expanding systematic reviews and meta‐analyses on the effects of school‐wide positive behavior interventions and supports. Psychology in the Schools, 57(5), 783–804. https://doi.org/10.1002/pits.22336.
42. Pas, E. T., Ryoo, J. H., Musci, R. J., & Bradshaw, C. P. (2019). A state-wide quasi-experimental effectiveness study of the scale-up of school-wide positive behavioral interventions and supports. Journal of School Psychology, 73, 41–55. https://doi.org/10.1016/j.jsp.2019.03.001.
43. Estrapala, S., Rila, A., & Bruhn, A. L. (2021). A systematic review of tier 1 PBIS implementation in high schools. Journal of Positive Behavior Interventions, 23(4), 288–302. https://doi.org/10.1177/1098300720929684.
44. Freeman, J., Kern, L., Gambino, A. J., Lombardi, A., & Kowitt, J. (2019). Assessing the relationship between the Positive Behavior Interventions and Supports Framework and student outcomes in high schools. Journal of At-Risk Issues, 22(2), 1–11. https://files.eric.ed.gov/fulltext/EJ1231342.pdf.
45. Freeman, J., Simonsen, B., McCoach, D. B., Sugai, G., Lombardi, A., & Horner, R. (2016). Relationship between school-wide positive behavior interventions and supports and academic, attendance, and behavior outcomes in high schools. Journal of Positive Behavior Interventions, 18(1), 41–51. https://doi.org/10.1177/1098300715580992.
46. Durlak, J. A., Mahoney, J. L., & Boyle, A. E. (2022). What we know, and what we need to find out about universal, school-based social and emotional learning programs for children and adolescents: A review of meta-analyses and directions for future research. Psychological Bulletin, 148(11-12), 765–782. https://doi.org/10.1037/bul0000383.
47. Taylor, R., Oberle, E., Durlak, J. A., & Weissberg, R. P. (2017). Promoting positive youth development through school-based social and emotional learning interventions: A meta-analysis of follow-up effects. Child Development, 88(4), 1156–1171. https://doi.org/10.1111/cdev.12864.
48. Todić, J., Cubbin, C., Armour, M., Rountree, M., & González, T. (2020). Reframing school-based restorative justice as a structural population health intervention. Health & Place, 62. https://doi.org/10.1016/j.healthplace.2020.102289.
49. Larson, S., Chapman, S., Spetz, J., & Brindis, C. (2017). Chronic childhood trauma, mental health, academic achievement, and school-based health center mental health services. Journal of School Health 87(9), 675–686. https://doi.org/10.1111/josh.12541.
50. Centers for Disease Control and Prevention. (n.d.) Youth Risk Behavior Surveillance System (YRBSS). https://www.cdc.gov/healthyyouth/data/yrbs/index.htm.
51. The School District of Philadelphia (SDP) administered the Youth Risk Behavior Survey (YRBS) to 1,351 randomly selected high school students from 30 Philadelphia public schools in the fall of 2021. Results are considered representative of the entire District. https://www.philasd.org/research/2021/10/21/summary-of-student-responses- from-the-2021-philadelphia-youth-risk-behavior-survey/.
52. Internal data, Qlik Philly School Experience Survey Application, Accessed May, 2023.
53. Reitano, A., McCrossan, E., Fornaro, E., Pylvainen, H., Lesnick, J., and Wolford, T. (2023). Highlights of key findings from the Superintendent’s Listening and Learning Tour. School District of Philadelphia. https://www.philasd.org/ research/2023/01/23/highlights-of-key-findings-from-the-superintendents-listening-and-learning-tour/.
54. Regional Education Laboratory Appalachia & Cross-State Collaborative to Support Schools in the Opioid Crisis. (2021). Menu of Trauma-Informed Programs for Schools [Handout]. Institute of Education Sciences. https://ies.ed.gov/ncee/edlabs/regions/appalachia/events/materials/04-8-20-Handout2_menu-trauma-informed- programs-for-schools.pdf.
55. Centers for Disease Control and Prevention. (n.d.) Youth Risk Behavior Surveillance System (YRBSS). https://www.cdc.gov/healthyyouth/data/yrbs/index.htm.
56. The School District of Philadelphia (SDP) administered the Youth Risk Behavior Survey (YRBS) to 1,351 randomly selected high school students from 30 Philadelphia public schools in the fall of 2021. Results are considered representative of the entire District. https://www.philasd.org/research/2021/10/21/summary-of-student-responses- from-the-2021-philadelphia-youth-risk-behavior-survey/.
57. Internal data, Qlik Philly School Experience Application, Accessed May, 2023.
58. Dandridge, S. (2020). Improving school health services for children in Philadelphia: An evaluation report for the School District of Philadelphia. Children’s Hospital of Philadelphia PolicyLab. https://policylab.chop.edu/tools-and- memos/improving-school-health-services-children-philadelphia-evaluation-report-school.
59. Internal data, Qlik School Employee Hiring Application, Accessed May, 2023.
60. Yoder, C. M. (2020). School nurses and student academic outcomes: An integrative review. Journal of School Nursing, 36(1), 49–60. https://journals.sagepub.com/doi/full/10.1177/1059840518824397.
61. Pennsylvania Department of Education. (n.d.). Full-time school nurses for the management of students with asthma. Pennsylvania Evidence Resource Center. https://www.evidenceforpa.org/strategies/full-time-nurses- for-students- with-asthma.
62. Moricca, M. L., Grasska, M. A., Marthaler, M. B., Morphew, T., Weismuller, P. C., & Galant, S. P. (2013). School asthma screening and case management: Attendance and learning outcomes. The Journal of School Nursing, 29(2), 104–112. https://doi.org/10.1177/1059840512452668.
63. American Telemedicine Association. (2021). A framework for eliminating health disparities using telehealth. https://www.americantelemed.org/resource/research/.
64. Reynolds, C. A. and Maughan, E. D. (2015). Telehealth in the school setting: An integrative review. Journal of School Nursing 31(1) 44-53.
65. Hickson, M., Ettinger de Cuba, S., Weiss, I., Donofrio, G., & Cook, J. (n.d.). Too hungry to learn: Food insecurity and school readiness. Children’s HealthWatch. https://www.childrenshealthwatch.org/wp-content/uploads/ toohungrytolearn_report.pdf.
66. Weinstein, S., Hawes, P., Fornaro, E., & McCrossan, E. (2022). Household food insecurity in the School District of Philadelphia. School District of Philadelphia, Office of Research and Evaluation. https://www.philasd.org/research/ wp-content/uploads/sites/90/2022/04/Food-Insecurity-in-SDP-2020-21-April-2022.pdf.
67. Weinstein et al (2022).
68. Reitano, A., McCrossan, E., Fornaro, E., Pylvainen, H., Lesnick, J., and Wolford, T. (2023). Highlights of key findings from the Superintendent’s Listening and Learning Tour. School District of Philadelphia. https://www.philasd.org/ research/2023/01/23/highlights-of-key-findings-from-the-superintendents-listening-and-learning-tour/.
69. Listening and Learning: Teacher attendance, student attendance, and dropout prevention. Spring 2023. Internal document.
70. Internal data, Qlik Philly School Experience Survey Application, Accessed May 2023.
71. Fornaro, E. G., McCrossan, E., Hawes, P., Erdem, E., & McLoughlin, G. M. (2022). Key determinants to school breakfast program implementation in Philadelphia public schools: Implications for the role of SNAP-Ed. Frontiers in Public Health 10. https://doi.org/10.3389/fpubh.2022.987171.
72. Hartline-Grafton, H. (2019). School meals are essential for student health and learning. Food Research Action Center. https://frac.org/wp-content/uploads/School-Meals-are-Essential-Health-and-Learning_FNL.pdf.
73. Cohen, J.F.W., Hecht, A. A., McLoughlin, G. M., Turner, L., & Schwartz, M. B. (2021). Universal school meals and associations with student participation, attendance, academic performance, diet quality, food security, and body mass index: A systematic review. Nutrients 13(3), 911-952. https://doi.org/10.3390/nu13030911.
74. Adolphus, K., Lawton, C. L., & Dye, L. (2013). The effects of breakfast on behavior and academic performance in children and adolescents. Frontiers in Human Neuroscience 7. https://www.frontiersin.org/articles/10.3389/ fnhum.2013.00425/full.
75. Philadelphia Evidence Resource Center (2021). Breakfast in the classroom. https://www.evidenceforpa.org/ strategies/breakfast-in-the-classroom.
76. Anderson, M. L., Gallagher, J., & Ritchie, E. R. (2017, March). School lunch quality and academic performance (NBER Working Paper No. 23218). https://www.nber.org/system/files/working_papers/w23218/w23218.pdf.
77. Tkatch, C., Erdem-Akcay, E. and Cassar, E. (2019). Expanding school breakfast participation, 2017-2018. School District of Philadelphia, Office of Research and Evaluation. https://www.philasd.org/research/wp-content/ uploads/sites/90/2019/01/Expanding-School-Breakfast-Participation-2017-18-Research-Brief-January-2019.pdf.
78. Fornaro, E. G., McCrossan, E., Hawes, P., Erdem, E., & McLoughlin, G. M. (2022). Key determinants to school breakfast program implementation in Philadelphia public schools: Implications for the role of SNAP-Ed. Frontiers in Public Health 10. https://doi.org/10.3389/fpubh.2022.987171.
79. Fornaro, E. G., McCrossan, E., Hawes, P., Erdem, E., & McLoughlin, G. M. (2022). Key determinants to school breakfast program implementation in Philadelphia public schools: Implications for the role of SNAP-Ed. Frontiers in Public Health 10. https://doi.org/10.3389/fpubh.2022.987171.
80. Hartline-Grafton, H. (2019). School meals are essential for student health and learning. Food Research Action Center.https://frac.org/wp-content/uploads/School-Meals-are-Essential-Health-and-Learning_FNL.pdf.
81. Bullying in schools. Children’s Hospital of Philadelphia: Center for Violence Prevention. https://violence.chop.edu/bullying-schools.
82. Internal data, Qlik Philly School Experience Survey Application, Accessed May 2023.
83. Salmon, G., James, A., & Smith, D. M. (1998). Bullying in schools: self reported anxiety, depression, and self esteem in secondary school children. BMJ 317, 924-925. https://doi.org/10.1136/bmj.317.7163.924.
84. Listening and Learning: Teacher attendance, student attendance, and dropout prevention. Spring 2023. Internal document.
85. Massey, W. V., Perez, D., Neilson, L., Thalken, J., & Szarabajko, A. (2021). Observations from the playground: Common problems and potential solutions for school-based recess. Health Education Journal, 80(3), 313-326. https://doi.org/10.1177/0017896920973691.
86. Fortson, J., James-Burdumy, S., Bleeker, M., Beyler, N., London, R. A., Westrich, L., Stokes-Guinan, K., & Castrechini, S. (2013). Impact and implementation findings from an experimental evaluation of playworks effects on school climate, academic learning, student social skills and behavior. Mathematica Policy Research. https://www.mathematica.org/ publications/impact-and-implementation-findings-from-an-experimental-evaluation-of-playworks-effects-on-school-climate-academic-learning-student-social-skills-and-behavior.
87. Negus, S. & Karakus, M. (2018). Playworks TeamUp Model evaluation: Year 2 Report. School District of Philadelphia, Office of Research and Evaluation. https://www.philasd.org/research/wp-content/uploads/sites/90/2018/08/ EvaluationReport2018_-Playworks_Final.pdf.
 Priority Area 2
Partner with families and community
To live our core values of trust and collaboration, the District must foster trusting relationships with students, families, staff, and the entire Philadelphia community through transparent communication and frequent opportunities for partnership. Students, families, and staff expect the District to provide necessary information in an accessible and timely manner and to offer consistent opportunities for engagement to join in our work. Community partners expect clarity, consistency, and access to information to support relationships between the District and the Philadelphia community.
Forging strong partnerships and creating clear collaborative structures between the District and our broader community will enable us all to collectively support accelerated student achievement. Through the implementation of these Strategic Actions, families, students, staff, and community members will have greater access to information and timely responses, expanded access to enriching and well-rounded co-curricular opportunities, and new structures for collaboration with the Superintendent and District as a whole.
Strategic Actions
2.1 Launch a two-way communications system with multilingual capabilities to improve communications with families and the community.
2.2 Update the District and school websites.
Why is this urgent?
Survey data shows that stakeholders believe one of Dr. Watlington’s first priorities should be communication and engagement. During Listening and Learning sessions, families voiced that trying to communicate with the District can be frustrating because it is unclear who to contact about their concerns, and issues are not always addressed in a timely manner. When feedback is sought, it often feels performative or like “lip service” rather than a true opportunity to provide meaningful input. Stakeholders believe there is a lack of transparent communication, particularly around logistics, schedule changes, capital project planning, and work order processes, which makes planning difficult for families and school leaders. Similarly, members of the Violence Impacting Schools working group identified shortcomings in the way the District communicates about community safety and violent incidents. This results in a lack of trust between families and the District. District students and their families speak a variety of languages, and it is critical that systems of communication are accessible to all families in their preferred language.
Why these strategies?
Clear and open communication is critical for establishing trusting relationships between families and schools, which fosters greater engagement. Students with engaged parents and guardians are more likely to earn higher grades and test scores, attend school regularly, have better social skills, and graduate and go on to postsecondary education. Connecting students, families, and schools with community assets can promote student achievement, expand access to health and wellness resources, and help break the cycle of poverty.
Aligns with: Guardrail 3; Transition Team Recommendations
2.3 Launch a Superintendent’s parent and guardian advisory group that reflects our diversity, including parents and guardians of underserved students, students with disabilities, and English Learners.
2.4 Launch a Superintendent’s teacher advisory group.
2.5 Launch a Superintendent’s principal advisory group.
2.6 Relaunch a Superintendent’s student advisory group.
2.7 Launch a Superintendent’s advisory group with external stakeholders and community partners.
Why is this urgent?
During Listening and Learning sessions, parents and guardians, teachers, principals, students, and community members shared that they want more opportunities to have their opinions and experiences heard and considered in decision-making. Stakeholders also feel that decisions made by the Central Office sometimes feel abrupt and arbitrary, and that decisions should be made based on shared values. On the annual survey, only 11% of teachers strongly agreed that they feel respected by the District, and only 22% of principals strongly agreed that they feel respected by the District.
Why these strategies?
A collaborative decision-making model means that families, students, and school staff are included in the decision-making processes that directly impact their work and learning. This structure enhances the ability of schools to respond to problems and opportunities, improves relationships between leaders and key stakeholders, increases satisfaction and morale, facilitates better decision making by eliciting more viewpoints, and helps reduce stress and burnout. School-community partnerships can enable the expansion of services and resources for students, and are often most effective when community partners and districts have a strong relationship based on collaboration and respect.
Aligns with: Guardrail 3; Transition Team Recommendations
2.8 Create a database of all District partnerships, their alignment to the strategic plan, and impact.
Why is this urgent?
Schools reported a total of 1,646 external support programs in 2019-20, provided by 1,050 organizations, with an average of 15 programs per school. The data suggests that current school partnerships are not equitably distributed among schools, nor are they always meeting the critical needs of schools. During Listening and Learning sessions, stakeholders discussed how community
Priority Area 2 partnerships are a key way to bring in more resources; however, there is a need to improve coordination between the District, schools,
and community partners. Additionally, stakeholders shared significant concerns about managing partnerships and explained that they do not have the capacity to manage all the available partnerships that could benefit their students and communities. Thirty-two schools reported that they had a partnerships coordinator. School leaders reported that limited staff capacity to establish and/or coordinate partner programs was a challenge to partnership development.
Why this strategy?
Improving schools involves addressing the social and economic challenges that students and their families face. Building partnerships strengthens the capacity of schools to respond to student needs. Partnerships can enhance students’ social, emotional, and intellectual development. However, with limited time and numerous needs, it is the responsibility of the District to ensure that partnerships are properly aligned to the needs of schools and they are meeting the agreed upon expectations in terms of operations and outcomes.
Aligns with: All Goals and Guardrails; Transition Team Recommendations
2.9 Relaunch Parent University to provide resources and support to families and community.
Why is this urgent?
Census data shows that almost 22% of Philadelphians are living below the poverty line, 13% do not have a high school diploma, and only 33% have a bachelor’s degree or higher. This speaks to the need for adult education programming. Additionally, Listening and Learning feedback highlighted that there is a lack of trust between families and the District; engaging parents and guardians in workshops and training is a way to increase engagement, which can help to build positive relationships and repair trust.
Why this strategy?
Participation in adult education programming increases access to the knowledge and skills that enable social mobility and increased democratic participation. Furthermore, a study found that districts play an important role in providing adult education, as they are responsible for providing over half of the adult education programming available across the nation. Not only can participating in a parent university have positive outcomes for parents and guardians, but research has found that students can benefit when their parents and guardians have the skills and resources to be engaged in their education.
Aligns with: Guardrails 1 and 3
2.10 Establish a parent ambassador role (with paid stipends).
Why is this urgent?
During Listening and Learning sessions, parents and guardians expressed how they have lost trust in the District and are often frustrated by the lack of communication about important aspects of their child’s education. Currently, schools share Family Liaisons that report to the Office of Family and Community Engagement. A way to improve positive relationships with parents and guardians and improve communication is to ensure that all schools have a dedicated liaison that can focus on a single school community and connect parents and guardians with their schools and the District.
Why this strategy?
Parent ambassadors are members of the school community that have established relationships with parents and guardians. As part of a larger initiative to increase parent/guardian engagement with schools, parent ambassadors can be a way to build parent/guardian networks across school communities as well as spread the word about district-provided support and resources for parents and guardians.
Aligns with: Guardrails 1 and 3
2.11 Evaluate and replicate successful Community School models.
Why is this urgent?
Community Schools provide resources that can address many of the barriers that our students and families face. In addition to providing students with wrap-around services, such as health centers, before and after school activities, and social and employment services, community schools serve to enrich students’ academic experiences by connecting them with mentoring, internships, and employment opportunities. These services were all mentioned as desirable to help meet the needs of our students and their families during Listening and Learning sessions.
Why this strategy?
National research has shown that students who attend community schools have increased access to health care and higher graduation rates. A study of the Community School Initiative in Philadelphia during its first year found that there were some system level challenges to implementation at the school level, but stakeholders were satisfied with the initiative. Now that the Community School Initiative is in its sixth year, an updated evaluation would provide additional information about how community schools in Philadelphia are benefiting students and families, and how to replicate successful practices across community school sites.
Aligns with: All Goals, Guardrails 1 and 3
Supporting Research
88. Reitano, A., McCrossan, E., Fornaro, E., Pylvainen, H., Lesnick, J., and Wolford, T. (2023). Highlights of key findings from the Superintendent’s Listening and Learning Tour. School District of Philadelphia. https://www.philasd.org/ research/2023/01/23/highlights-of-key-findings-from-the-superintendents-listening-and-learning-tour/.
89. Reitano, A., McCrossan, E., Fornaro, E., Pylvainen, H., Lesnick, J., and Wolford, T. (2023). Highlights of key findings from the Superintendent’s Listening and Learning Tour. School District of Philadelphia. https://www.philasd.org/ research/2023/01/23/highlights-of-key-findings-from-the-superintendents-listening-and-learning-tour/.
90. Bryk, A. S., & Schneider, B. (2002). Trust in schools: A core resource for improvement. Russell Sage Foundation. http://www.jstor.org/stable/10.7758/9781610440967.
91. Constantino, S. (2007). Keeping parents involved through high school. The Education Digest 73(1), 57-61; Epstein, J. L. (2010). School/Family/Community Partnerships: Caring for the Children We Share. Phi Delta Kappan, 92(3), 81–96, https://doi.org/10.1177/003172171009200326.
92. Drummond, K. & Stipek, D. (2004) Low income parents’ beliefs about their role in children’s academic learning. The Elementary School Journal, 104(3), 197–213. https://doi.org/10.1086/499749.
93. Hoover-Dempsey, K. V. & Sandler, H. M.(1997). Why do parents become involved in their children’s education?, Review of Educational Research, 67(1) 3–42. https://doi.org/10.2307/1170618.
94. Horvat, E. M. (2011). Pioneer parents and creating pathways for involvement: A historical case study of school change and collective parental involvement. In C. Hands & L. Hubbard (Eds.), Including Families and Communities in Urban Education (pp. 161–188). Information Age Publishing.
95. Moore, K. A. & Emig, C. (2014). Integrated student supports: A summary of the evidence base for policymakers [White paper]. Child Trends. https://cms.childtrends.org/wp-content/uploads/2014/02/2014-05ISSWhitePaper3.pdf.
96. Dryfoos, J. G. (2000). Evaluation of community schools: Findings to date. Coalition for Community Schools. https://files.eric.ed.gov/fulltext/ED450204.pdf.
97. Moore, K. (2014). Making the grade: Assessing the evidence for integrated student supports. Child Trends. https://cms.childtrends.org/wp-content/uploads/2014/02/2014-07ISSPaper2.pdf.
98. Reitano, A., McCrossan, E., Fornaro, E., Pylvainen, H., Lesnick, J., and Wolford, T. (2023). Highlights of key findings from the Superintendent’s Listening and Learning Tour. School District of Philadelphia. https://www.philasd.org/ research/2023/01/23/highlights-of-key-findings-from-the-superintendents-listening-and-learning-tour/.
99. Internal data, Qlik Philly School Experience Application, Accessed May, 2023.
100. Clark, S. N. & Clark, D. C. (2002). Collaborative decision making: A promising but underused strategy for middle School Improvement. Middle School Journal, 33(4), 52–57, https://doi.org/10.1080/00940771.2002.11494684.
101. Liontos, L. B. (1993). Shared decision-making. Oregon School Study Council, 37(2). https://files.eric.ed.gov/fulltext/ED363969.pdf.
102. Sanders, M. G. (2006). Building school–community partnerships: Collaboration for student success. Thousand Oaks, CA: Corwin Press.
103. Carter, K. (2021). School support census 2019-20 report. School District of Philadelphia, Office of Research and Evaluation. https://www.philasd.org/research/wp-content/uploads/sites/90/2021/08/School-Support-Census-2019-20-Report-July-2021.pdf.
104. Reitano, A., McCrossan, E., Fornaro, E., Pylvainen, H., Lesnick, J., and Wolford, T. (2023). Highlights of key findings from the Superintendent’s Listening and Learning Tour. School District of Philadelphia. https://www.philasd.org/ research/2023/01/23/highlights-of-key-findings-from-the-superintendents-listening-and-learning-tour/.
105. Reitano, A., McCrossan, E., Fornaro, E., Pylvainen, H., Lesnick, J., and Wolford, T. (2023). Highlights of key findings from the Superintendent’s Listening and Learning Tour. School District of Philadelphia. https://www.philasd.org/ research/2023/01/23/highlights-of-key-findings-from-the-superintendents-listening-and-learning-tour/.
106. Internal Data, Qlik School Support Census Application, Accessed May, 2023.
107. Reitano, A., McCrossan, E., Fornaro, E., Pylvainen, H., Lesnick, J., and Wolford, T. (2023). Highlights of key findings from the Superintendent’s Listening and Learning Tour. School District of Philadelphia. https://www.philasd.org/ research/2023/01/23/highlights-of-key-findings-from-the-superintendents-listening-and-learning-tour/.
108. Noguera, P. A. & Wells, L. (2011). The politics of school reform: A broader and bolder approach for Newark. Berkeley Review of Education, 2(1), 5–25. https://files.eric.ed.gov/fulltext/EJ1169709.pdf.
109. Sanders, M. G. (2006). Building school–community partnerships: Collaboration for student success. Corwin Press. https://doi.org/10.4135/9781452224831.
110. U.S. Census Bureau. Population estimate for Philadelphia County, July 1, 2022. https://www.census.gov/quickfacts/philadelphiacountypennsylvania.
111. Reitano, A., McCrossan, E., Fornaro, E., Pylvainen, H., Lesnick, J., and Wolford, T. (2023). Highlights of key findings from the Superintendent’s Listening and Learning Tour. School District of Philadelphia. https://www.philasd.org/ research/2023/01/23/highlights-of-key-findings-from-the-superintendents-listening-and-learning-tour/.
112. Cervero, R. & Wilson, A. (2001). Power in practice: Adult education and the struggle for knowledge and power in society. San Francisco: Jossey-Bass Inc.
113. Tamassia, C., Lennon, M., Yamamoto, K., & Kirsch, I. (2007). Adult education in America: A first look at results from the adult education program and learner surveys. Education Testing Service.
114. Mendez, J. L. and Swick, D. C. (2018). Guilford Parent Academy. Education and Treatment of Children (41)2, 249-268.
115. Listening and Learning: Teacher attendance, student attendance, and dropout prevention. Spring 2023. Internal document.
116. Mendez, J. L. and Swick, D. C. (2018). Guilford Parent Academy. Education and Treatment of Children (41)2, 249-268.
117. Moore, K. & Ernig, C. (2014). Integrated student supports: A summary of the evidence base for policymakers. Child Trends Publication #2015-05.
118. Coalition for Community Schools. Community schools: Partnerships for excellence. Institute for Education Leadership. http://www.communityschools.org/assets/1/Page/partnershipsforexcellence.pdf.
119. Lubell, E. (2011). Building community schools: A guide for action. National Center for Community Schools, The Children’s Aid Society.
120. Listening and Learning: Teacher attendance, student attendance, and dropout prevention. Spring 2023. Internal document.
121. IFC International (2010). Communities in schools national evaluation: Five Year Summary. https://www.theoryofchange.org/wp-content/uploads/toco_library/pdf/2010_-_ICF_International_-_Communities_In_Schools_National_Evaluation_Five_Year_Summary_Report.pdf.
122. Dryfoos, J. (2000). Evaluation of community schools: Findings to date. Washington, DC: Coalition for Community Schools.
123. Duffy, M. and McCarty, A. (2018). The community school initiative: Year 1 Report. Research for Action. https://www.researchforaction.org/research-resources/k-12/the-philadelphia-community-schools-initiative-year-1- evaluation/.
 Priority Area 3
Accelerate academic achievement
The District’s primary goal is to provide the learning environments and supports necessary for all students to develop foundational academic skills and graduate college and career ready. We also know that high-quality, well-supported teachers and principals are imperative to our students’ academic achievement, especially in math, English Language Arts, and science. As such, we must provide all schools with rigorous, standards-aligned, culturally relevant curricula and prepare all leaders and educators to use high- quality and inclusive instructional tools. Further, we can expand equitable access to various course offerings that fit our students’ interests and goals, and create opportunities for students to receive additional support that meets their unique learning needs. When these Strategic Actions are implemented, all students will attend schools that enable them to succeed.
Strategic Actions
3.1 Inventory and improve access to high quality Pre-K programs for underserved populations.
Why is this urgent?
According to Philadelphia’s Commission on Universal Pre-Kindergarten only 1 in 3 of Philadelphia’s three- and four- year olds has access to affordable, quality Pre-K. According to Pre-K for PA, 37% of eligible children in Philadelphia do not have access to high-quality, publicly funded Pre-K.
Why this strategy?
Decades of research suggest several immediate benefits related to participation in high quality Pre-K, including increases in reading readiness and critical thinking, improved self-control and social skills, and higher classroom confidence. Recent research finds that students who participated in high quality Pre-K are more likely to enroll in advanced high school coursework, attend school regularly, and graduate on time. High quality Pre-K programs are defined by those that are aligned with rigorous and culturally appropriate learning standards, use a strong curriculum, employ highly trained teachers, provide adequate professional development, maintain a low child-staff ratio, screen and refer students for health related barriers to learning, and have a teacher observation and feedback system in place.
Aligns with: Goals 1-3
3.2 Purchase and implement standards-aligned core instructional resources for math (in partnership with teachers, school leaders, and parents and guardians).
3.3 Purchase and implement standards-aligned core instructional resources for English Language Arts (ELA), with a focus on the Science of Reading (in partnership with teachers, school leaders, and parents and guardians).
3.4 Purchase and implement standards-aligned core instructional resources for science (in partnership with teachers, school leaders, and parents and guardians).
Why is this urgent?
In 2021-22, 17% of grade 3-12 students were proficient or advanced in math on the end-of-year state standardized assessments (PSSA Math and Keystone Algebra 1 exams); 36% of grade 3-12 students were proficient or advanced in ELA on the state end-of-year standardized assessments (PSSA ELA and Keystone Literature exams); and 33% of grade 4 and 8-12 students were proficient or advanced in science on the state end-of-year standardized assessments (PSSA Science and Keystone Biology exams). Teachers and school leaders have voiced that clear and consistent curricular resources are needed across schools. A curriculum audit also raised the need for a district-wide academic program that is aligned to Common Core standards and that is clearly based on a theory of action about how to improve student achievement.
Why these strategies?
The use of a rigorous curriculum in combination with high quality materials can positively impact the quality of classroom instruction and student achievement.
Number competency in Kindergarten and first grade strongly and significantly predict later math achievement, and in some cases reading achievement, even when controlling for differences in other academic areas, behavior, cognitive development, family characteristics, and home environment. Students who are not skilled readers by the end of third grade are unlikely to graduate high school. Structured Literacy, based on the Science of Reading, is the most effective approach to teaching students to learn to read. Research suggests the majority of students in general education classrooms, and nearly all students with specialized needs, benefit from this approach to literacy. Research has shown that students who participate in design-based or project-based science curricular programming had more developed higher order thinking skills (critical thinking, problem solving, and application) and higher proficiency levels on the state science assessment than their peers who participated in traditional science courses. This strategy will ensure we use these research- based approaches to teaching math, reading, and science.
Aligns with: Goals 1-4; Transition Team Recommendations
3.5 Pilot evidence-based high impact tutoring in 6 to 8 schools.
Why is this urgent?
The COVID-19 pandemic had a negative impact on student achievement; one study estimates that students lost four months of learning by the end of the 2020-21 school year. Many District students are not meeting grade level standards, and require opportunities for accelerated learning to catch up.
Why this strategy?
High impact tutoring can be effective at advancing student achievement when delivered with fidelity. Important aspects to consider when selecting a tutoring approach are when and how often the tutoring occurs, the quality of the materials used, and the extent to which tutors receive the necessary training and support. A study of Saga Education by the University of Chicago found that students who received tutoring with fidelity learned up to 2.5 years worth of math in one year.
Aligns with: Goals 1-3
3.6 Pilot a year-round and extended-day school calendar in up to 10 schools.
Why is this urgent?
Many SDP students are not meeting grade level standards, and require opportunities for accelerated learning to catch up. During Listening and Learning sessions, students and teachers discussed wanting more opportunities to participate in programming before and after the traditional school day and highlighted the benefits of spending structured time with their peers beyond the hours of the current school day.
Why this strategy?
Participating in high quality out-of-school time programming or extracurricular activities is tied to the improvement of a variety of outcomes for students, including math and reading achievement, physical and mental health, school attendance, promotion, graduation, college enrollment, and increased civic engagement. External research also suggests summer and after school programming can be effective in accelerating learning, provided there are small staff-to-student ratios, and adequate dosage in terms of hours. Incorporating these types of opportunities into the day-to-day school experience, rather than as “extra” or “additional” supports that students must sign up for, will likely result in similar positive effects for students.
In the United States, “year-round schooling” does not mean that students are in school for more days out of the year. Rather, the typical number of required school days, which is 180 in Pennsylvania, is spread out over the year so that there are more frequent, shorter breaks instead of having the extended summer break. For example, some schools in California that have a year-round-schooling model have a “60/20 calendar,” which means there are 60 days of instruction followed by 20 days of vacation.
Research on these types of year-round school models have found no positive effects on student achievement. Taken together, the research suggests that simply reallocating seat time across the year is not an adequate strategy for improving student achievement. Changes to the calendar must be paired with opportunities for students to participate in enriching and meaningful learning experiences that are not typically incorporated into the traditional school year due to time constraints.
Aligns with: Guardrail 2
3.7 Pilot learn to swim programs in different parts of the city in alignment with the curriculum.
Why is this urgent?
Drowning is the second leading cause of unintentional injury death for children ages 5-14 in the United States. Black/African American and Latino urban youth report having poor swimming skills at higher rates than their white peers, putting them at greater risk of swimming related injury or death.
Why this strategy?
When children and adults participate in swimming lessons, their risk of drowning is reduced.
Aligns with: Guardrails 1, 2, and 4
3.8 Audit and improve compliance with Individualized Education Plans (IEPs) and expand supports for English Learners.
Why is this urgent?
The special education population in the District is large and diverse. In 2022-23, more than 18,000 students are receiving specialized education supports across nine different types of programs. The District also serves a large and diverse population of English Learners (EL). In 2022-23, there were more than 20,000 EL students with over 150 different home languages. This represents an increase of 3,000 ELs over the prior school year. The EL population includes students with specialized needs, including newcomers, students with limited or interrupted formal education, and long-term English Learners.
Why this strategy?
The Individuals with Disabilities Education Act “…requires public school systems to develop appropriate Individualized Education Programs (IEPs) for each child. The specific special education and related services outlined in each IEP reflect the individualized needs of each student.” When districts are compliant with IEPs, students are receiving the appropriate supports for learning and are more likely to have improved outcomes. Similarly, when districts promote challenging activities with the right support for English Learners, students are more likely to achieve English proficiency and engage in grade level content.
Aligns with: All Goals; Transition Team Recommendations
3.9 Provide more support to teachers in the areas of content knowledge, student engagement, and culturally and linguistically relevant instructional practices.
Why is this urgent?
During Listening and Learning sessions, stakeholders voiced that there is a need for more Diversity, Equity, and Inclusion professional development and training for teachers and staff. On the annual survey, 47% of teachers said that a lack of support for teaching special education students was a challenge; 38% said lack of support for teaching English Learners was a challenge; and 70% said range of student abilities was a challenge to student learning. On the annual survey, less than half (45%) of students said that their school meets their learning needs most or all of the time.
Why this strategy?
Research shows that special populations of students are best served when teachers are engaged with professional development that “builds educator capacity to understand how gender, race, class, language, ethnicity, and ability differences are perceived and treated in the institution and influenced by implicit bias and micromessaging.” Additionally, teachers need support to use effective scaffolds to engage students in rigorous instruction; promote quality interactions, critical thinking, and discourse; use formative assessment to assess progress; and honor students’ home languages, assets, and experiences in the classroom.
Aligns with: All Goals, Guardrail 4; Transition Team Recommendations
3.10 Establish a baseline standard for which courses, programs, academy models, and co-curricular opportunities will be offered in all schools (Elementary, Middle, and High School).
Why is this urgent?
In Listening and Learning sessions, students voiced they would like access to a wider variety of courses and electives that are more aligned with their interests, are relevant to their lives, and prepare them for their future. On the annual survey, fewer than 4 in 10 students reported that they learn interesting things in their classes most or all of the time.Stakeholders also believe that art and music classes should be available to all students each year.
Additionally, feedback was given that rigorous academic courses should be offered in all schools, not just in criteria-based schools. In the 2021-22 school year, 61% of District high schools offered Advanced Placement (AP) courses, 11% offered International Baccalaureate (IB) courses, and 43% offered dual enrollment or college level courses. Many of the new Act 158 graduation pathways also depend on these opportunities. Currently, 34 out of 130 (26%) schools that serve 8th grade students offer Algebra 1. These schools are mostly concentrated in Center City and Northeast Philadelphia.
Why this strategy?
The intensity and quality of a student’s high school curriculum is a strong predictor of bachelor’s degree completion. For example, a high score on the AP final or IB final exam in any AP or IB course, or participation in dual enrollment programming, is positively correlated with college enrollment and persistence rates. Research shows that students who enter career academies are more likely to earn a diploma or General Educational Development (GED) credential, have more post-secondary opportunities, and higher wages than similar students who do not. Studies have also found that 9th Grade Academies can effectively support students’ transition to, and successful completion of, 9th grade. Academies are most successful when they implement the following with fidelity: have a dedicated space in the school building for 9th grade students; have a dedicated 9th grade teaching staff with regularly scheduled time for collaboration; and a dedicated 9th grade administrator. While the District currently supports 9th Grade Academies, they are implemented with varying degrees of fidelity.
Art and music education are also key factors in the success of students in school and beyond. There is a positive relationship between involvement in the arts and increased positive non-academic behaviors, including participating in student government, volunteering, voting, decreased delinquency and drug use, increased self-esteem, and more positive interactions with peers and adults. There is some evidence that suggests that learning a foreign language promotes knowledge acquisition for students. Additionally, since many of the most competitive colleges have language requirements, all schools should offer at least two years of a foreign language in addition to Spanish and French, languages that many District students already speak as their native language.
Algebra can be a “gatekeeper” to success in advanced math and in the job market, especially in STEM-related careers. However, it is important that this strategy be accompanied by increased rigor in pre-algebra courses, as research shows that if students enroll in Algebra I before they are ready, they may end up struggling with coursework, which can decrease the likelihood that they take higher level math.
Aligns with: All Goals, Guardrails 2 and 4; Transition Team Recommendations
3.11 Develop a project team to recommend optimal middle school design, programming, and facilities.
Why is this urgent?
According to Listening and Learning sessions with school leaders, in some cases, middle grade students are not properly prepared for the transition to high school. Specifically, leaders discussed: 1) inadequate investment in pre-algebra and literacy skills during middle school years; 2) a lack of exposure to career paths, high school options, and postsecondary opportunities; and 3) a lack of focus on preparing students for the social and operational aspects of high school.
Why this strategy?
Research suggests that there is no significant difference in the academic performance of middle school students who attend K-8 schools and those who attend true middle schools.However, students in middle grades are more likely to fall behind academically than students in younger grades and, if not properly identified and supported, risk being off track for high school graduation. What is most important is that the school is properly resourced to: 1) respond to the specific needs of middle school students, 2) deliver an instructional program that prepares students for the rigor of high school, and 3) develop a sense of attachment and belonging.
Aligns with: Goals 1, 3, and 4
3.12 Appoint an administrator to identify, audit, and improve access for underserved students to Career and Technical Education (CTE) and building trades programs across the city in alignment with regional workforce trends.
Why is this urgent?
In the spring of 2022, less than half (43%) of students in Career and Technical Education (CTE) programs passed their occupational competency tests, assessments of whether or not their skills meet industry standards. Performance varied across schools and CTE programs. However, during Listening and Learning sessions, teachers, community members, and parents and guardians said they would like to see more CTE and internship opportunities.
Why this strategy?
Career and Technical Education (CTE) provides students opportunities to personalize their education based on their career interests and unique learning needs. Compared to non-CTE students, CTE students are likely to graduate from high school on time, enroll in postsecondary education within two years of their expected high school graduation year, and have higher median annual earnings. Research done in the District mirrors these findings: participation in CTE is associated with higher graduation rates for students. Also, CTE students who do not meet promotion requirements in grades 10 or 11 are more likely to catch back up if they continue their CTE program. The District recently partnered with the Southern Regional Education Board (SREB) to conduct a comprehensive evaluation of all CTE programs from January 2023 through July 2025. The evaluation will identify strengths, areas for improvement, and best practices for each CTE program, ensure they are in alignment with local and regional workforce demands, and replicate model programs throughout the District.
Aligns with: Goals 4 and 5; Transition Team Recommendations
3.13 Expand 9th Grade On-Track (Success Networks) to reduce dropouts and increase four year graduation rates.
Why is this urgent?
In the spring of 2022, 29% of 9th grade students tested on grade level in ELA and 19% in math. Moreover, at the end of the 2021-22 school year, less than a third (27%) of 9th graders were firmly on track to graduate in four years. During Listening and Learning sessions, school leaders and students emphasized the importance of supporting students through the transition to high school so that they feel comfortable in a larger setting with new students and better understand academic expectations.
Why this strategy?
School District of Philadelphia data consistently shows that 9th Grade On-Track status is linked with on-time graduation. Research from Chicago shows that 9th Grade Success Networks have increased on-time graduation rates. The District can leverage and expand a promising existing program, that is modeled off of the program in Chicago, and established through a partnership with the Neubauer Foundation.
Aligns with: Goal 4
3.14 Hire an administrator to better coordinate a District-wide dropout reduction strategy.
Why is this urgent?
As of April 2023, over 3,600 District students in grades 7-12 dropped out of school. Not completing high school is associated with poor economic and health outcomes throughout life as well as an increased risk of incarceration.
Why this strategy?
Many of the reasons associated with dropping out are complex and require the coordination of services across offices and providers. Supportive interventions, such as mentoring and restorative practices, can have a positive effect on attitudes about school for students, especially those who are transitioning back from a long-term placement. This is important because students returning from long-term placement are at a high risk of dropping out and benefit from intense levels of adult support and service coordination, which schools do not always have the capacity to provide.
Aligns with: Goal 4 and Guardrail 1
3.15 Launch a financial literacy module for all high schools.
Why is this urgent?
Nearly 1 in 4 Philadelphians live below the poverty line and 12% live in deep poverty. Currently, 42 out of 73 District and Alternative schools serving students in grades 9-12 for which data is available offer a financial literacy course.
Why this strategy?
Although the evidence is mixed, financial literacy courses may help students develop the knowledge and skills that support financial planning. Learning these skills can lead to greater financial independence, responsible decision-making, and active participation in the economy, ultimately contributing to students’ overall well-being and success. However, access to wealth, not poor financial management, is the primary challenge faced by people living in poverty. The literature cautions against financial literacy approaches that attribute poverty to a gap in financial knowledge and skills rather than a system that functions to maintain wealth inequality.
Aligns with: Goals 4 and 5
3.16 Implement quarterly benchmark assessments to provide teachers, parents and guardians, and students with information about learning progress.
Why is this urgent?
The District currently does not have a standardized benchmark assessment program. Benchmark assessments can be useful for communicating expectations for learning, planning curriculum and instruction, monitoring and evaluating instructional and/or program effectiveness, and predicting future performance. In order for benchmark assessments to fulfill these purposes, they should be aligned to the curriculum, scope and sequence, and to the Common Core Standards.
Why this strategy?
A balanced assessment system is one that is coherent, based on a theory of action, and efficient. When these criteria are met, districts can ensure that each assessment is necessary to gather data that will help meet classroom, school, and district-level goals, and that students are not over-assessed.
Aligns with: All Goals
3.17 Reorganize learning networks to place resources closer to families and communities and to improve student outcomes.
Why is this urgent?
The District’s network structure is one of the key ways strategic support is disseminated to schools. School leaders vary greatly in their perception of District support. On the annual survey, 40% of school leaders reported that the District does not provide appropriate support for school leaders to act as talent managers; 51% reported that the District does not provide appropriate support to enable principals to act as instructional leaders; and 48% reported that the District does not provide appropriate instructional support for teachers.
Why this strategy?
School networks should create the conditions to successfully support school leaders, centering schools as the unit of change. Effective network design can further a District’s theory of action by: 1) supporting the alignment and equitable distribution of resources to address the primary barriers to student achievement, and 2) supporting school leader autonomy and accountability. In order to achieve this ideal, the District needs to assess the assets and gaps of our current structure and reconceptualize how the network structure can best meet the needs of schools.
Aligns with: All Goals and Guardrails; Transition Team Recommendations
3.18 Develop a “rounds model” for Central Office staff to visit schools, provide support, and debrief feedback.
Why is this urgent?
During Listening and Learning sessions, school-based staff members shared that they want Central Office leadership to spend more time visiting schools. Over 40% of Central Office staff members indicate that they spend a majority of their time working directly with other Central Office staff members. Though not surprising or inappropriate, this finding highlights the need to facilitate contact between Central Office and school-based staff.
Why this strategy?
School networks should create the conditions to successfully support school Central Office site visits are an effective way for program offices to familiarize themselves with the context of each school and gather school level feedback to inform decisions. This strategy is guided by the principle that Central Office staff members can best learn about the ways in which their programs, decisions, and processes impact schools by being present in schools, developing relationships with school-based staff members, and seeing what their guidance looks like in practice.
Aligns with: All Goals and Guardrails; Transition Team Recommendations
Supporting Research
124. Philadelphia Commission on Universal Pre-Kindergarten (2016). Final recommendations report.
125. PreK for PA. (2022.) Snapshot for Philadelphia County: High quality, publicly funded pre-K. https://www.prekforpa.org/county-facts-PDFs/Philadelphia-Pre-K-for-PA.pdf.
126. Barnett, W. S. (2008). Preschool education and its lasting effects: Research and policy implications. Education and the Public Interest Center & Education Policy Research Unit. https://nepc.colorado.edu/publication/ preschool-education.
127. Center for Research on Children in the United States (2020). Universal pre-K: The long-term benefits that exceed short-term costs. Georgetown University Mccourt School of Public Policy. https://mccourt.georgetown.edu/ news/universal-pre-k-long-term-benefits-exceed-short-term-costs/.
128. Friedman-Krauss, A.H., Barnett, W.S., Hodges, K.S., Garver, K.A., Weisenfeld, G.G., Gardiner, B.A. & Jost, T.M. (2023). The state of preschool 2022, National Institute for Early Education Research. https://nieer.org/wp-content/uploads/ 2023/05/YB2022_FullReport.pdf.
129. Internal Data, Qlik PSSA & Keystone Application, Accessed May, 2023.
130. Reitano, A., McCrossan, E., Fornaro, E., Pylvainen, H., Lesnick, J., and Wolford, T. (2023). Highlights of key findings from the Superintendent’s Listening and Learning Tour. School District of Philadelphia. https://www.philasd.org/ research/2023/01/23/highlights-of-key-findings-from-the-superintendents-listening-and-learning-tour/.
131. Council of the Great City Schools (2020). A review of the academic program of the School District of Philadelphia. Internal Report.
132. Chiefs for Change. (2019). Choosing wisely: How states can help districts adopt high‐quality instructional materials. https://chiefsforchange.org/wp-content/uploads/2019/04/CFC-ChoosingWisely-FINAL-1.pdf.
133. Steiner, D. (2017). Curriculum research: What we know and where we need to go. https://standardswork.org/wp-content/uploads/2017/03/sw-curriculum-research-report-fnl.pdf.
134.Jordan, N. C., Kaplan, D., Ramineni, C., & Locuniak, M. N. (2009). Early math matters: kindergarten number competence and later mathematics outcomes. Developmental Psychology, 45(3), 850-867. https://www.ncbi.nlm.nih.gov/pmc/articles/PMC2782699/.
135.Ten Braak, D., Lenes, R., Purpura, D. J., Schmitt, S. A., & Størksen, I. (2022). Why do early mathematics skills predict later mathematics and reading achievement? The role of executive function. Journal of Experimental Child Psychology, 214, 1-186. https://www.sciencedirect.com/science/article/pii/S0022096521002241.
136. Fiester, L and Smith, R. (2010). Early warning! Why reading by the end of third grade matters. Annie E. Casey Foundation. https://assets.aecf.org/m/resourcedoc/AECF-Early_Warning_Full_Report-2010.pdf.
137. Ray, J.S. (2020). Structured literacy supports all learners: Students at-risk of literacy acquisition – Dyslexia and English learners. Texas Association for Literacy Education Yearbook 7, 37- 43. https://files.eric.ed.gov/fulltext/EJ1286919.pdf.
138.Robinson, L., Lambert, M. C., Towner, J., & Caros, J. (2016). A comparison of direct instruction and balanced literacy: An evaluative comparison for a Pacific Northwest rural school district. Reading Improvement, 53(4), 147–164.
139. Borman, G. D., Dowling, N. M., & Schneck, C. (2008). A multisite cluster randomized field trial of Open Court Reading. Educational Evaluation and Policy Analysis, 30(4), 389-407.
140. Cox, C. (2023). The impact of a design-based engineering curriculum on high school biology: Evaluating academic achievement and student perceptions of epistemology, self-efficacy, and self-determination in life science. https://digitalcommons.kennesaw.edu/cgi/viewcontent.cgi?article=1067&context=teachleaddoc_etd.
141. Geier, R., Blumenfeld, P. C., Marx, R. W., Krajcik, J. S., Fishman, B., Soloway, E., & Clay‐Chambers, J. (2008). Standardized test outcomes for students engaged in inquiry‐based science curricula in the context of urban reform. Journal of Research in Science Teaching: The Official Journal of the National Association for Research in Science Teaching, 45(8), 922-939. https://deepblue.lib.umich.edu/bitstream/handle/2027.42/61206/20248_ftp.pdf?sequence.
142. Cooper, D., Wernecke, M. L., Shanfelder, J. & Fynes, S. (2022). COVID’s impact on children in Philadelphia: The case for an ambitious rebound. Children First. https://www.childrenfirstpa.org/wp-content/uploads/2022/08/ Philadelphia-County-2022-1.pdf.
143. Reyes, R., Schlesinger, M. and Lesnick, J. (2023). PSSA performance trends from 2014-15 to 2021-22. School District of Philadelphia. https://www.philasd.org/research/2023/01/17/pssa-and-keystone-performance- trends-2014-15-to-2021-22/.
144. Schlesinger, M. Reitano, A. and Reyes, R. (2022).Star reading curriculum based measures (CBM) participation and performance: 2021-22. School District of Philadelphia. https://www.philasd.org/research/2022/10/17/star-reading-curriculum-based-measures-cbm-participation-and-performance-2021-22/.
145. Reyes, R., Schlesinger, M. and Lesnick, J. (2023). Keystone performance trends from 2014-15 to 2021-22. School District of Philadelphia. https://www.philasd.org/research/2023/01/17/pssa-and-keystone-performance-trends- 2014-15-to-2021-22/.
146. Jacob, R. Armstrong, C. Bowden, B. A. & Pan, Y. (2016) Leveraging volunteers: An experimental evaluation of a tutoring program for struggling readers. Journal of Research on Educational Effectiveness, 9(sup1), 67-92.
147. Robinson, C. D., Kraft, M. A., Loeb, S. & Schueler, B. E. (2021). Accelerating student learning with high-dosage tutoring. EdResearch for Recovery. https://annenberg.brown.edu/recovery/edresearch1.
148. Guryan, J. Ludwig, J. Bhatt, M. P., Cook, P. J., Davis, J. M. V, Dodge, K. Farkas, G., Fryer, R. G. Jr. Mayer, S. Pollack, H. & Steinberg, L. (2021).Not too late: Improving academic outcomes among adolescents. National Bureau of Economic Research. https://www.nber.org/system/files/working_papers/w28531/w28531.pdf.
149. Reyes, R., Schlesinger, M. and Lesnick, J. (2023). Keystone performance trends from 2014-15 to 2021-22. School District of Philadelphia. https://www.philasd.org/research/2023/01/17/pssa-and-keystone-performance- trends-2014-15-to-2021-22/.
150. Reyes, R., Schlesinger, M. and Lesnick, J. (2023). PSSA performance trends from 2014-15 to 2021-22. School District of Philadelphia. https://www.philasd.org/research/2023/01/17/pssa-and-keystone-performance- trends-2014-15-to-2021-22/.
151. Schlesinger, M. Reitano, A. and Reyes, R.(2023). Star reading curriculum based measures (CBM) participation and performance: 2021-22. School District of Philadelphia. https://www.philasd.org/research/2022/10/17/ star-reading-curriculum-based-measures-cbm-participation-and-performance-2021-22/.
152. Reitano, A., McCrossan, E., Fornaro, E., Pylvainen, H., Lesnick, J., and Wolford, T. (2023). Highlights of key findings from the Superintendent’s Listening and Learning Tour. School District of Philadelphia. https://www.philasd.org/ research/2023/01/23/highlights-of-key-findings-from-the-superintendents-listening-and-learning-tour/.
153.Neild, R.C., Wilson, S.J., & McClanahan, W. (2019). Afterschool programs: A review of evidence under the Every Student Succeeds Act. Philadelphia: Research for Action.
154. Lauer P. A., Akiba M., Wilkerson S. B., Apthorp H.S., Snow D., Martin-Glenn M.L. (2006). Out-of-school-time programs: a meta-analysis of effects for at-risk students. Review of Educational Research, 76(2), 275–313.
155.Dumais, S. A. (2009). Cohort and gender differences in extracurricular participation: The relationship between activities, math achievement, and college expectations. Sociological Spectrum, 29(1), 72–100.
156. Everson, H. T. & Millsap, R. E. (2005). Everyone gains: Extracurricular activities in high school and higher SAT scores. College Entrance Examination Board. https://files.eric.ed.gov/fulltext/ED562676.pdf.
157. Knifsend, C. & Graham, S. (2012). Too much of a good thing? How breadth of extracurricular participation relates to school-related affect and academic outcomes during adolescence. Journal of Youth & Adolescence, 41(3), 379-89.
158. Lopez, M. H. & Moore, K. (2006). Participation in sports and civic engagement. CIRCLE. Medford, MA.
159. Peck, S. C., Roeser, R. W., Zarrett, N., & Eccles, J. S. (2008). Exploring the roles of extracurricular activity quantity and quality in the educational resilience of vulnerable adolescents: Variable- and pattern-centered approaches. The Journal of Social Issues, 64(1), 135–156.
160. Cooper, H., Charlton, K., Valentine, J.C., & Muhlenbruck, L. (2000). Making the most of summer school: A meta-analytic review. Monographs of the Society for Research in Child Development, 65(1), 119-127.
161. Zvoch, K., &Stevens, J.J. (2013), Summer school effects in a randomized field trial. Early Childhood Research Quarterly, 28(1), 24-32.
162. Graves, J. (2011). Effects of year-round schooling on disadvantaged students and the distribution of standardized test performance. Economics of Education Review, 30(6), 1281-1305.
163. California Department of Education (2023). Year-Round Education Program Guide: https://www.cde.ca.gov/ls/fa/yr/guide.asp
164.McMullen, Steven C., and Kathryn E. Rouse. 2012. The impact of year-round schooling on academic achievement: Evidence from mandatory school calendar conversions. American Economic Journal: Economic Policy, 4(4), 230-52.
165. Graves, J. (2011). Effects of year-round schooling on disadvantaged students and the distribution of standardized test performance. Economics of Education Review, 30(6), 1281-1305.
166. Wu, A.D. and Stone, J.E. (2010). Does year round schooling affect the outcome and growth of California’s API scores? Journal of Educational Research & Policy Studies, 10(1), 79-97.
167. McMillen, B.J. (2010). A statewide evaluation of academic achievement in year-round schools. The Journal of Education Research, 95(2), 67-74.
168. OECD (2021), How much time do students spend in the classroom?, in Education at a Glance 2021: OECD Indicators, OECD Publishing, Paris, https://doi.org/10.1787/399475ac-en.
169. Centers for Disease Control and Prevention, National Center for Injury Prevention and Control. Web-based injury statistics query and reporting system (WISQARS).
170. Irwin C. C., Irwin R. L., Ryan T. D., et al (2009). Urban minority youth swimming (in)ability in the United States and associated demographic characteristics: toward a drowning prevention plan. Injury Prevention, 15, 234-239.
171. Brenner R.A., Taneja G.S., Haynie D.L., Trumble A.C., Qian C., Klinger R.M., Klevanoff M.A. (2009). Association between swimming lessons and drowning in childhood: A case-control study. Archives of Pediatrics & Adolescent Medicine, 163(3), 203–210.
172. Pharr J, Irwin C, Layne T, Irwin R. (2018) Predictors of swimming ability among children and adolescents in the United States. Sports, 6(1), 17.
173. School Profiles, October 1 Enrollment: School District of Philadelphia: https://dashboards.philasd.org/extensions/enrollment-public/index.html#/
174. School Profiles, October 1 Enrollment: School District of Philadelphia: https://dashboards.philasd.org/extensions/enrollment-public/index.html#/
175. U.S. Department of Education. (2004). Individuals with Disabilities Act.
176.Woods, A. D., Morgan, P. L., Wang, Y., Farkas, G., & Hillemeier, M. M. (2023). Effects of having an IEP on the reading achievement of students with learning disabilities and speech or language impairments. Learning Disability Quarterly.
177. National Alliance for Partnerships in Equity Education Foundation (NAPE) (2021). Strategies for special population success: Practical tips and tools for educators. https://napequity.org/wp-content/uploads/NAPE-National-Special- Populations-Brief.pdf.
178. Hodge, J., Carranza, R., Williams, F., Silva, V., & Casserly, M. (2014). A Framework for raising expectations and instructional rigor for English language learners.A Framework for Raising Expectations and Instructional Rigor for English Language Learners.
179. Reitano, A., McCrossan, E., Fornaro, E., Pylvainen, H., Lesnick, J., and Wolford, T. (2023). Highlights of key findings from the Superintendent’s Listening and Learning tour. School District of Philadelphia. https://www.philasd.org/ research/2023/01/23/highlights-of-key-findings-from-the-superintendents-listening-and-learning-tour/.
180.Internal Data, Qlik Philly School Experience Survey Application, Accessed May, 2023.
181. National Alliance for Partnerships in Equity Education Foundation (NAPE) (2021). Strategies for special population success: Practical tips and tools for educators. https://napequity.org/wp-content/uploads/NAPE-National-Special- Populations-Brief.pdf.
182. Hodge, J., Carranza, R., Williams, F., Silva, V., & Casserly, M. (2014). A framework for raising expectations and instructional rigor for English language learners. Council of Great City Schools. https://www.cgcs.org/cms/lib/dc00001581/centricity/domain/4/framework%20for%20raising%20expectations.pdf
183. Chang, S., Lozano, M., Neri, R., & Herman, J. (2017). High-leverage principles of effective instruction for English learners. University of California at Los Angeles, National Center for Research on Evaluation, Standards, and Student Testing. https://csaa.wested.org/wp-content/uploads/2019/11/HighLeveragePrinciplesforELinstruction_Resource_0.pdf
184. Reitano, A., McCrossan, E., Fornaro, E., Pylvainen, H., Lesnick, J., and Wolford, T. (2023). Highlights of key findings from the Superintendent’s Listening and Learning Tour. School District of Philadelphia. https://www.philasd.org/ research/2023/01/23/highlights-of-key-findings-from-the-superintendents-listening-and-learning-tour/.
185. Internal Data, Qlik Philly School Experience Survey Application, Accessed May, 2023.
186. Listening and Learning: Teacher attendance, student attendance, and dropout prevention. Spring 2023. Internal document.
187. Internal Data, Qlik Course Marks & Credits Application, Accessed May, 2023.
188. Reform Support Network. (2015). Leading indicators for school improvement: A review of State Education Agency practices.https://files.eric.ed.gov/fulltext/ED611445.pdf.
189. Hein, V., & Smerdon, B. (2013). Predictors of postsecondary success.American Institutes for Research College and Career Readiness Success Center. https://ccrscenter.org/sites/default/files/CCRS%20Center_Predictors% 20of%20Postsecondary%20Success_final_0.pdf.
190. Kemple, J. J., & Snipes, J. C. (2008). Career academies: Impacts on students’ engagement and performance in high school. https://www.mdrc.org/publication/career-academies-long-term-impacts-work-education-and- transitions-adulthood.
191.Styron, R.A. and Peasant, E.J. (2010). Improving student achievement: Can 9th Grade Academies make a difference? International Journal of Education Policy and Leadership (5)3, 1-9. https://eric.ed.gov/?id=EJ898895.
192. Legters, N., Parise, L. and Rappaport, S. (2013). Implementing Ninth Grade Academies in Broward County, Florida. MDRC. https://www.mdrc.org/project/evaluation-ninth-grade-academies#related-content.
193. Somers, M.A. and Garcia, I. (2016). Helping students make the transition into high school: The effect of Ninth Grade Academies on students’ academic and behavioral outcomes. MDRC. https://www.mdrc.org/publication/helping-students-make-transition-high-school.
194. Karakus, M., Reitano, A. and Negus, S. (2020). Implementation of the Ninth Grade Academy model, 2018-19. School District of Philadelphia. https://www.philasd.org/research/2020/02/21/ninth-grade-academy-year-1-report/.
195. Catterall, J., Dumais, S., & Hampden-Thompson, G. (2012). The arts and achievement in at-risk youth: Findings from four longitudinal studies. National Endowment for the Arts. Washington, DC.
196. Israel, D. (2009). Staying in school: Arts education and New York City high school graduation rates. The Center for Arts Education. New York, NY.
197. President’s Committee on the Arts and the Humanities. (2011). Reinvesting in arts education: Winning America’s future through creative schools. Washington, DC
198. Ruppert, S. (2006). Critical evidence: How the arts benefit student achievement. National Assembly of State Arts Agencies & Arts Education Partnerships. Washington, DC
199. Murphy, V.A., Arndt, H., Baffoe-Djan, J.B., Chalmers, H., Macaro, E., Rose, H. Vanderplank, R. and Woore, R. (2020). Foreign language learning and its rapid impact on wider academic outcomes: A rapid evidence assessment. University of Oxford. https://files.eric.ed.gov/fulltext/ED612981.pdf.
200. Schoenfeld, A.H., (1995). Is thinking about ‘Algebra’ a misdirection? In C. Lacampagne, W. Blair & J. Kaput (Eds)., The Algebra Colloquium. Volume 2: Working Group Papers (pp. 83-86). Washington, DC: US Department of Education, Office of Educational Research and Improvement.
201. C. T. Clotfelter, H. F. Ladd, & J. L. Vigdor, (2012), The aftermath of accelerating algebra: Evidence from a district policy initiative (CALDER Working Paper No. 69), National Center for Analysis of Longitudinal Data in Education Research. https://eric.ed.gov/?id=ED529166.
202. T. Loveless. (2008). How well are American students learning? With sections on international assessments, the misplaced math student, and urban schools. Brown Center on Education Policy, Brookings Institution. https://eric.ed.gov/?id=ED506869.
203. Listening and Learning: Teacher attendance, student attendance, and dropout prevention. Spring 2023. Internal document.
204. Weiss, C. C., & Kipnes, L. (2006). Reexamining middle school effects: A comparison of middle grades students in middle schools and K–8 schools. American Journal of Education, 112(2), 239–272. https://doi.org/10.1086/498996.
205. Williams, T., Kirst, M., Haertel, E., Rosin, M., Perry, M., Webman, B., & Woodward, K. M. (2010). Gaining ground in the middle grades: Why some schools do better. Mountain View, CA: EdSource, 76, 14-18.
206. Carolan, B. V., & Chesky, N. Z. (2012). The relationship among grade configuration, school attachment, and achievement. Middle School Journal, 43(4), 32–39. http://www.jstor.org/stable/41432111.
207. Internal Data, Qlick Course Marks and Credits Application, Accessed May 2023.
208. Reitano, A., McCrossan, E., Fornaro, E., Pylvainen, H., Lesnick, J., and Wolford, T. (2023). Highlights of key findings from the Superintendent’s Listening and Learning Tour. School District of Philadelphia. https://www.philasd.org/ research/2023/01/23/highlights-of-key-findings-from-the-superintendents-listening-and-learning-tour/.
209. Wills, T. (2019). Analysis of career and technical education (CTE) in SDP: 2013-14 and 2014-15 9th graders who participated in CTE, with comparisons to those who did not. The School District of Philadelphia Office of Research and Evaluation. https://www.philasd.org/research/wp-content/uploads/sites/90/2021/06/CTESlidedeck_Cohort1314_Cohort1415_PUBLIC_Final.pdf.
210. U.S. Department of Education (2019). Bridging the skills gap: Career and technical education in high school. https://www2.ed.gov/datastory/cte/index.html.
211. Brodersen, R., Gagnon, D., Liu, J., & Tedeschi, S. (2021). The impact of career and technical education on postsecondary outcomes in Nebraska and South Dakota (REL 2021–087).
212. Wills, T., Goldberg, A., and Wolford, T. (2016). Career and technical evaluation (CTE) program evaluation. School District of Philadelphia. https://www.philasd.org/research/wp-content/uploads/sites/90/2021/02/CTE-2014-15-Program-Evaluation-Research-Report-May-2016.pdf.
213. Internal Data, Qlik Academic Screeners Application, Accessed May, 2023.
214. Internal Data, Qlik Course Marks and Credits Application, Accessed May, 2023.
215. Listening and Learning: Teacher attendance, student attendance, and dropout prevention. Spring 2023. Internal document.
216. Tanz, A., and Erdem-Akcay, E. (2020). From ninth grade on-track to college matriculation: The path of the 2015-16 SDP ninth-grade cohort. School District of Philadelphia. https://www.philasd.org/research/category/college-career/high-school-graduation/on-track-to-graduation-metric/.
217. Carnegie Foundation for the Advancement of Teaching (Producer). (2021). Spotlight on UChicagon network for college success: Increasing 9th grade success and high school graduation in Chicago. [Video]. https://www.carnegiefoundation.org/engage-with-us/events/spotlight-on-uchicago-network-for-college-success-increasing-9th-grade-success-and-high-school-graduation-in-chicago/.
218. Internal Data, Qlik Dropouts Monitoring Application, Accessed May, 2023.
219. Hernandez, D.J. (2012). Double jeopardy: How third-grade reading skills and poverty influence high school Graduation. Baltimore, MD: The Annie E Casey Foundation.
220. Everyday Labs (2021). Student being present: A comprehensive summary of student absenteeism research. https://f.hubspotusercontent40.net/hubfs/4875399/Case%20Studies%20and%20Briefs/000037_Research_The%20Power%20of%20Being%20Present_R3.pdf.
221. U.S. Department of Education (2019). Chronic absenteeism in the nation’s schools: A hidden educational crisis. https://www2.ed.gov/datastory/chronicabsenteeism.html#four.
222. Kelchner, V.P., Evans, K., Brendell, K., Allen, D., Miller, C., & Cooper-Haber, K. (2017). The effect of a school-based transitional support intervention program on alternative school youth’s attitudes and behaviors. The Professional Counselor 7(2), 169–184. https://doi:10.15241/vpk.7.2.169.
223. Kelchner, V.P., Evans, K., Brendell, K., Allen, D., Miller, C., & Cooper-Haber, K. (2017). The effect of a school-based transitional support intervention program on alternative school youth’s attitudes and behaviors. The Professional Counselor 7(2), 169–184. https://doi:10.15241/vpk.7.2.169.
224. Phue, J.H., Martin, K., Gonzalez, M. and Hall, Rishaun. Philadelphia 2023: The state of the city. Pew Charitable Trust. https://www.pewtrusts.org/-/media/assets/2023/04/philadelphia-2023-the-state-of-the-city.pdf.
225. Internal data, Qlik Course Marks and Credits Application, Accessed May 2023.
226. Hastings, J. S., Madrian, B. C., & Skimmyhorn, W. L. (2013). Financial literacy, financial education, and economic outcomes. Annu. Rev. Econ., 5(1), 347-373.
227. Urban, C., Schmeiser, M., Collins, J. M., & Brown, A. (2020). The effects of high school personal financial education policies on financial behavior. Economics of Education Review, 78, 101786.
228. Walstad, W. B., Rebeck, K., & MacDonald, R. A. (2010). The effects of financial education on the financial knowledge of high school students. Journal of Consumer Affairs, 44(2), 336-357.
229. Hamilton, D. and Darity, W.A., (2017). The political economy of education, financial literacy, and the racial wealth gap. Review, 99(1), 59-76. http://dx.doi.org/10.20955/r.2017.59-76.
230. McKenzie, C. (2022). Understanding racial trauma’s impact on financial literacy. https://www.nefe.org/news/2022/08/understanding-racial-traumas-impact-on-financial-literacy.aspx.
231. Herman, J. L., Osmundson, E., & Dietel, R. (2010). Benchmark assessments for improved learning (AACC Policy Brief). Los Angeles, CA: University of California.
232. Council of the Great City Schools (2020). A review of the academic program of the School District of Philadelphia.
233. Chattergoon, R., & Marion, S. (2016). Not as easy as it sounds: Designing a balanced assessment system. The State Education Standard, 16(1), 6–9.
234. Internal Data, Qlik Philly School Experience Survey Application, Accessed May, 2023.
235. Pippert, K. Fenton, B. (2016). Principal supervisor network design toolkit. The Wallace Foundation.
236. Ouchi, W. G. (2006). Power to the principals: Decentralization in three large school districts. Organization Science, 17(2), 298-307.
237. Reitano, A., McCrossan, E., Fornaro, E., Pylvainen, H., Lesnick, J., and Wolford, T. (2023). Highlights of key findings from the Superintendent’s Listening and Learning Tour. School District of Philadelphia. https://www.philasd.org/ research/2023/01/23/highlights-of-key-findings-from-the-superintendents-listening-and-learning-tour/.
238. Reitano, A. (2020). Summary of feedback from School District of Philadelphia central office staff about the District Wide Survey. The School District of Philadelphia. https://www.philasd.org/research/2020/05/14/feedback-from-sdp-central-office-staff-about-the-district-wide-survey/.
239. Ikemoto, G. (2021). Prioritizing principals guidebook: Central office practices that support school leaders. The School Leadership District Cohort. George W. Bush Institute, Education Reform Initiative.
240. City, E. A., Elmore, R. F., Fiarman, S. E., & Teitel, L. (2009). Instructional rounds in education (Vol. 30). Cambridge, MA: Harvard Education Press.
 Priority Area 4
Recruit and retain diverse and highly effective educators
Teachers and school leaders are the most important factor when it comes to student learning and academic growth. When educators feel supported, valued, and respected, they are more likely to stay in their roles and build strong relationships with students, which is paramount to student joy and academic achievement. Ensuring that all school staff members are well-trained and prepared for their roles allows our schools to prioritize high-quality teaching and learning, and cultivate environments that are supportive and nurturing to both students and staff.
This work requires intentional efforts to overhaul our recruitment strategies, reduce onboarding time for new hires, and implement plans to train and develop staff across all roles. Through these Strategic Actions, the District will intentionally hire and retain a workforce that reflects the demographics of our student populations, provide ongoing and relevant professional development, and create opportunities to attract and grow individuals who will serve our students well.
Strategic Actions
4.1 Establish instructional leadership teams (Principal, Assistant Principal, Climate Manager, Literacy and Math School-Based Teacher Leaders, and Special Education Compliance Monitor) at every school and provide them with training and resources.
Why is this urgent?
During Listening and Learning sessions, stakeholders explained that good school leaders support collaboration and shared-decision making among school teams.The District’s Employee Exit Survey data shows that half of teachers and instructional staff respondents who resigned for reasons under the District’s control said that their supervisor’s leadership/management style was a primary reason. Enhancing training and resources for school leaders and leadership teams is therefore key to ensuring that teachers feel well-supported.
Why these strategies?
Support from school administration is one of the most important factors in teachers’ decisions to stay in a school or in the profession, especially in urban, high-poverty public schools. When instructional decision-making is made by an instructional leadership team, rather than just a principal, school staff are more invested and committed to implementation. Developing principals who include teachers in decision-making and promote positive school climates may have an impact on retention.
Aligns with: All Goals and Guardrails; Transition Team Recommendations
4.2 Pilot recruitment and retention incentives for teachers and principals to reduce vacancies in hard to staff schools.
4.3 Appoint an administrator to audit and analyze staffing data to make recommendations to address long-term District staffing needs.
4.4 Develop innovative retention approaches for hard to staff positions.
Why is this urgent?
Decades of research have indicated that teacher quality is among the most critical factors in student learning, as students with more effective teachers have greater gains in test scores. The ability to recruit skilled teachers, assign them to appropriate and equitable roles, and retain the most effective among them is a major factor in school effectiveness. Nationally, the most effective and highly certified teachers are less likely to be teaching in schools that serve poor and minority students. This is also the case in the District, where higher percentages of teachers with emergency certifications are teaching in the schools with the lowest levels of academic achievement and highest levels of student need.
Why these strategies?
A single approach is not sufficient to recruit and retain high quality teachers.Hiring and performance incentives must also be combined with strong school leadership, responsive and differentiated teacher development, and incorporating teacher feedback in decision-making.
Aligns with: All Goals and Guardrails; Transition Team Recommendations
4.5 Recruit more Black and Latino male teachers and principals, in partnership with colleges, universities, the Center for Black Educator Development, and the Mayor’s Commission on African American males to improve Black and Latino male student outcomes.
4.6 Develop a teacher preparation middle college high school in partnership with colleges, universities, and the Center for Black Educator Development.
4.7 Expand “Grow-Your-Own” programs for aspiring teachers and leaders with attention to historically underserved groups.
Why is this urgent?
Teachers of color have been found to have a positive impact on learning gains and social-emotional well-being for students of color. However, nationally, while 53% of K-12 students are students of color, only about 20% of teachers are teachers of color. In the District, 61% of instructional staff are white compared to 14% of students.
Why these strategies?
Increasing teacher diversity within a school may enhance the well-being of teachers of color, leading to improved satisfaction and reduced turnover. Experts have recommended partnering with local teacher preparation programs, including those at minority-serving institutions, to coordinate student teaching placements and vet candidates before they graduate, and there are successful models for these approaches for hiring teachers of color, such as in the state of Minnesota.
“Grow-your-own” programs have been found to be particularly effective in recruiting teachers of color. For example, alternative teacher and principal preparation programs have proven to successfully recruit and retain teachers and leaders of color. Overall, The National Center for Educational Evaluation (NCEE) found that the percentage of teachers from Teacher Residency Programs (TRP) who remained in their starting district was 15 percentage points higher compared to non-TRP teachers. Additionally, a national study shows that the first-year attrition rate for teachers recruited from paraeducator career ladder programs is considerably lower than attrition rates of other first-year teachers.
The District’s paraprofessional to teacher pathway program has become a model program for supporting historically underrepresented groups of employees as they seek to become classroom educators in our District. There are currently 114 paraprofessionals participating in the pathway program, with more starting next school year. Sixteen are graduating and moving into teacher roles next school year. The rest are graduating between December 2023 and December 2024, and are preparing to become teachers of record in elementary PreK-4 or other professionals within the District.
The District leader residency programs have also proven successful. Since the launch of the Aspiring Principals’ Academy, the percentage of first year principals that stepped into the role from being a District assistant principal position grew from 21% in 2017- 18 to 96% in 2021-22. In another program, 80% of Black men who participated were made eligible or have attained an assistant principal position for the 2023-24 school year.
Aligns with: All Goals and Guardrails; Transition Team Recommendations
4.8 Develop an aligned coaching and feedback model for instructional staff.
Why is this urgent?
On the 2021-22 annual survey, over half of teachers (54%) indicated that they rarely or never participate in professional development that involves observation and feedback. On the same survey, nearly one-third (30%) of school leaders reported that they spend five or fewer hours per week on instructional leadership activities that include observing classroom instruction and providing feedback.
Why these strategies?
Professional development opportunities, especially those that are differentiated based on teacher needs and informed by principal observations, strongly influence teacher retention.Teacher coaching, especially coaching experiences that are tailored to the individual needs of teachers and local contexts of the schools where they work, have demonstrated positive effects on teaching and learning. Coaching cycles, including those that use recorded lessons, have also been shown to improve the achievement of students in the classrooms of novice teachers and those teachers who need to improve their practice.
“Grow-your-own” programs have been found to be particularly effective in recruiting teachers of color. For example, alternative teacher and principal preparation programs have proven to successfully recruit and retain teachers and leaders of color. Overall, The National Center for Educational Evaluation (NCEE) found that the percentage of teachers from Teacher Residency Programs (TRP) who remained in their starting district was 15 percentage points higher compared to non-TRP teachers. Additionally, a national study shows that the first-year attrition rate for teachers recruited from paraeducator career ladder programs is considerably lower than attrition rates of other first-year teachers.
The District’s paraprofessional to teacher pathway program has become a model program for supporting historically underrepresented groups of employees as they seek to become classroom educators in our District. There are currently 114 paraprofessionals participating in the pathway program, with more starting next school year. Sixteen are graduating and moving into teacher roles next school year. The rest are graduating between December 2023 and December 2024, and are preparing to become teachers of record in elementary PreK-4 or other professionals within the District.
The District leader residency programs have also proven successful. Since the launch of the Aspiring Principals’ Academy, the percentage of first year principals that stepped into the role from being a District assistant principal position grew from 21% in 2017- 18 to 96% in 2021-22. In another program, 80% of Black men who participated were made eligible or have attained an assistant principal position for the 2023-24 school year.
Aligns with: All Goals and Guardrails; Transition Team Recommendations
4.9 Provide ongoing professional development for non-instructional job roles.
Why is this urgent?
Currently, the District employs 4,051 paraprofessionals, climate staff, and secretaries. These positions play a critical role in ensuring that the needs of our students and families are met. Moreover, 18% of the allotted positions remain vacant. Throughout Listening and Learning sessions, many staff members highlighted the need for additional development opportunities for non-instructional staff, particularly paraprofessionals and climate staff, to maximize their effectiveness with students and increase retention.
Why these strategies?
Studies have found that paraprofessionals report the need for additional training in order to best support students they work with. When they receive ongoing appropriate development, paraprofessionals have positive effects on students, particularly in the areas of supporting students with disabilities and increasing reading achievement.
Aligns with: All Goals and Guardrails; Transition Team Recommendations
4.10 Launch surveys that provide principals, Assistant Superintendents, and District leaders with feedback from their direct reports.
Why is this urgent?
School principals are evaluated based on a self assessment and feedback from their supervisors. This feedback does not take into account the experience of teachers and additional stakeholders, which is essential to helping leaders develop a better understanding of the ways in which they can improve their practice and rethink their current behaviors. Feedback from teachers and stakeholders is also helpful in developing individualized support plans to speak to specific needs of school leaders as identified by those who they work with most. While the Philly School Experience Survey (PSES) for teachers includes a leadership topic, the feedback is not specific to individual leaders, there is no formal mechanism for school leaders to regularly review and reflect on this feedback. Central Office employees do not take the PSES and have no mechanism to provide feedback to their supervisors. The lack of evaluations for Central Office leaders has been highlighted by stakeholders as a major barrier to Central Office effectiveness.
Why these strategies?
Schools with effective school leaders see higher teacher retention rates than those with less effective leaders. High performing teachers, in particular, are more likely to stay at a school with an effective school leader. One way to better understand school leader effectiveness is through a 360 feedback process, which includes the perceptions of teachers. Because teachers’ decisions to stay or leave a school is governed to a large extent by their relationship with their school leader, incorporating teacher perceptions in school leader evaluation systems can promote teacher retention. In regards to Central Office leadership, well designed surveys that solicit feedback about leaders in the workplace are useful tools for improving productivity and office culture.
Aligns with: All Goals and Guardrails
Supporting Research
241. Reitano, A., McCrossan, E., Fornaro, E., Pylvainen, H., Lesnick, J., and Wolford, T. (2023). Highlights of key findings from the Superintendent’s Listening and Learning tour. School District of Philadelphia. https://www.philasd.org/ research/2023/01/23/highlights-of-key-findings-from-the-superintendents-listening-and-learning-tour/.
242. Saleet, G., Reitano, A., Stewart, K. and Vanic M. (2021). Summary of teacher responses to the Employee Exit Survey, 2017-2021. School District of Philadelphia. https://www.philasd.org/research/wp-content/uploads/sites/90/2021/10/Teacher-Exit-Survey-Results-Brief-October-2021.pdf.
243. Nguyen, T. D., Pham, L., Springer, M. G., & Crouch, M. (2019). The factors of teacher attrition and retention: an updated and expanded meta-analysis of the literature. Annenberg Institute at Brown University, 19-149.
244. Bottoms, G., & Schmidt-Davis, J. (2010). The three essentials: improving schools requires district vision, district and state support, and principal leadership. Southern Regional Education Board (SREB).
245. Espinoza, D., Saunders, R., Kini, T., & Darling-Hammond, L. (2018). Taking the long view: State efforts to solve teacher shortages by strengthening the profession. Palo Alto, CA: Learning Policy Institute.
246. Ingersoll, R. M. (2001). Teacher turnover and teacher shortages: An organizational analysis. American Educational Research Journal, 38(3), 499-534.
247. Stosich, E.L, Forman, M.L., & Bocala, C. (2019). All together now: Internal coherence framework supports instructional leadership teams. The Learning Professional 40(3). https://learningforward.org/journal/learning-better-by-learning-together/all-together-now/.
248. Podolsky, A., Kini, T., Bishop, J., & Darling-Hammond, L. (2016). Solving the teacher shortage: how to attract and retain excellent educators. Palo Alto, CA: Learning Policy Institute. https://learningpolicyinstitute.org/sites/default/files/product-files/Solving_Teacher_Shortage_Attract_Retain_Educators_REPORT.pdf.
249. Aaronson, D., Barrow, L., & Sander, W. (2007). Teachers and student achievement in Chicago public high schools. Journal of Labor Economics (25), 95-135.
250. Rivkin, S., Hanushek, E., & Kain, J. Teachers, schools and academic achievement (2005). Econometrica, 73, 417-458.
251. Kane, T., Rockoff, J. & Staiger, D. What does certification tell us about teacher effectiveness? Evidence from New York City. Economics of Education Review (27), 615-631.
252. Loeb, S., Kalogrides, D., & Béteille, T. (2012). Effective schools: Teacher hiring, assignment, development, and retention. Education Finance and Policy, 7(3), 269-304.
253. Berry, B. & Eckert, J. (2012). Creating teacher incentives for school excellence and equity. Boulder, CO: National Education Policy Center.
254. Berry & Eckert (2012).
255. Navarez, C., Jouganatos, S. M., & Wood, J. (2019). Benefits of teacher diversity: Leading for transformative change. Journal of School Administration Research (4)1, 24-34. https://files.eric.ed.gov/fulltext/EJ1228575.pdf.
256. U.S. Department of Education, National Center for Education Statistics. (2017). Table 209.10. Number and percentage distribution of teachers in public and private elementary and secondary schools, by selected teacher characteristics: Selected years, 1987–88 through 2015–16. In Digest of Education Statistics, 2017.
257. U.S. Department of Education, National Center for Education Statistics. (2018). Table 203.50. Enrollment and percentage distribution of enrollment in public elementary and secondary schools, by race/ethnicity and region: Selected years, fall 1995 through fall 2027.
258. Internal data, Qlik Enrollment Application, Accessed May, 2023.
259. Internal data, School Employee Information Application, Accessed May, 2023.
260. Carver-Thomas, D. (2018). Diversifying the teaching profession: How to recruit and retain teachers of color. Palo Alto, CA: Learning Policy Institute. https://learningpolicyinstitute.org/media/165/download?inline&file=Diversifying_Teaching_Profession_REPORT.pdf.
261. Carver-Thomas, D. (2018).
262. Minnesota Department of Education. (n.d.). Collaborative Urban and Greater Minnesota Educators of Color Program. https://education.mn.gov/mdeprod/groups/educ/documents/grant/bwrl/mdcx/~edisp/mde071939.pdf.
263. Gist, C.D., Bianco, M. and Lynn, M. (2019). Examining grow your own programs across the teacher development continuum: Mining research on teachers of color and nontraditional educator pipelines. Journal of Teacher Education (70)1, 13-25. https://journals.sagepub.com/doi/full/10.1177/0022487118787504.
264. Institute of Education Sciences (2015). New findings on the retention of novice teachers from teaching residency programs. NCEE Evaluation Brief. https://ies.ed.gov/ncee/pubs/20154015/pdf/20154015.pdf.
265. Podolsky, A., Kini, T., Bishop, J., & Darling-Hammond, L. (2016). Solving the teacher shortage: How to attract and retain excellent educators. Palo Alto, CA: Learning Policy Institute.
266. School District of Philadelphia (2022, October 31). District announces additional funding to unique expand paraprofessional pathway program. SDP News. https://www.philasd.org/blog/2022/10/31/district-announces-additional-funding-to-expand-unique-paraprofessional-pathway-program/
267. Internal data, Office of Talent, provided May, 2023.
268. Internal data, Office of Leadership Development, provided May, 2023.
269. Internal data, Qlik Philly School Experience Survey Application, Accessed May, 2023.
270. Internal data, Qlik Philly School Experience Survey Application, Accessed May, 2023.
271. Nguyen, T. D., Pham, L., Springer, M. G., & Crouch, M. (2019). The factors of teacher attrition and retention: An updated and expanded meta-analysis of the literature. Annenberg Institute at Brown University, 19-149.
272. Bottoms, G., & Schmidt-Davis, J. (2010). The Three Essentials: Improving Schools Requires District Vision, District and State Support, and Principal Leadership. Southern Regional Education Board (SREB).
273. Kraft, M. A., Blazar, D., & Hogan, D. (2018). The effect of teacher coaching on instruction and achievement: A meta-analysis of the causal evidence. Review of Educational Research, 88(4), 547-588.
274. Clark, M., Max, J., James-Burdumy, S., Robles, S., McCullough, M., Burkander, P., and Malick, S. (2022). Study of teacher coaching based on classroom videos: Impacts on student achievement and teachers’ practices (NCEE 2022-006r). Washington, DC: U.S. Department of Education, Institute of Education Sciences, National Center for Education Evaluation and Regional Assistance. https://ies.ed.gov/ncee/pubs/2022006/pdf/2022006.pdf.
275. Internal Data, Qlik School Employee Information Application, Accessed May, 2023.
276. Reitano, A., McCrossan, E., Fornaro, E., Pylvainen, H., Lesnick, J., and Wolford, T. (2023). Highlights of key findings from the Superintendent’s Listening and Learning Tour. School District of Philadelphia. https://www.philasd.org/ research/2023/01/23/highlights-of-key-findings-from-the-superintendents-listening-and-learning-tour/.
277. Wiggs, N. B., Reddy, L. A., Bronstein, B., Glover, T. A., Dudek, C. M., & Alperin, A. (2021). A mixed‐method study of paraprofessional roles, professional development, and needs for training in elementary schools. Psychology in the Schools, 58(11), 2238-2254.
278. Keller, C.L., Bucholz, J., & Brady, M.P. (2007). Yes, I can!: Empowering paraprofessionals to teach learning strategies. Teaching Exceptional Children, 39(3), 18-23.
279. Giangreco, M.F. (2003). Working with paraprofessionals. Educational Leadership, 61(2), 50-53.
280. Deardorff, P., Glasenapp, G., Schalock, M., & Udell, T. (2007). TAPS: An innovative professional development program for paraeducators working in early childhood special education. Rural Special Education Quarterly, 26(3), 3-14.
281. Barrio, B. L., & Hollingshead, A. (2017). Reaching out to paraprofessionals: Engaging professional development aligned with universal design for learning framework in rural communities. Rural Special Education Quarterly, 36(3), 136–145.
282. Hemelt, S. W., Ladd, H. F., & Clifton, C. R. (2021). Do teacher assistants improve student outcomes? Evidence from school funding cutbacks in North Carolina. Educational Evaluation and Policy Analysis, 43(2), 280–304.
283. Dyer, K. M. (2001). The power of 360-degree feedback. Educational Leadership, 58(5), 35-38.
284. Reitano, A., McCrossan, E., Fornaro, E., Pylvainen, H., Lesnick, J., and Wolford, T. (2023). Highlights of key findings from the Superintendent’s Listening and Learning Tour. School District of Philadelphia. https://www.philasd.org/ research/2023/01/23/highlights-of-key-findings-from-the-superintendents-listening-and-learning-tour/.
285. Grissom, J. A., & Bartanen, B. (2019). Strategic retention: Principal effectiveness and teacher turnover in multiple-measure teacher evaluation systems. American Educational Research Journal, 56(2), 514-555.
286. Boyd, D., Grossman, P., Ing, M., Lankford, H., Loeb, S., & Wyckoff, J. (2011). The influence of school administrators on teacher retention decisions. American Educational Research Journal, 48, 303-333.
287. Knapp, M. S., Copland, . A., Plecki, M. L., & Portin, . S. (2006). Leading, learning, and leadership support. Seattle: Center for the Study of Teaching and Policy, University of Washington.
288. Boyd, D., Grossman, P., Ing, M., Lankford, H., Loeb, S., & Wyckoff, J. (2011). The influence of school administrators on teacher retention decisions. American Educational Research Journal, 48(2), 303-333.
289. Morrel-Samuels, P. (2002). Getting the truth into workplace surveys. Harvard Business Review. https://hbr.org/2002/02/getting-the-truth-into-workplace-surveys.
 Priority Area 5
Deliver efficient, high-quality, cost-effective operations
To achieve our goals as a District and to drive progress toward accelerated student achievement, we must have productive and equitable operations supported by high-functioning systems, clear prioritization, and strong accountability. It is essential that we cultivate a high-performing, collaborative, and results-oriented culture that supports school leadership teams as the unit of change. When budgeting, staffing, feedback cycles, and data systems are efficient, transparent, and aligned, all other aspects of the District can excel. These Strategic Actions address gaps in our current system and will enable the District to better provide direct support to schools, create a structured approach for implementing this Strategic Plan with fidelity, and support alignment through improved processes for hiring, budgeting, data use, and evaluations.
Strategic Actions
5.1 Establish a system-wide project management culture to improve organizational coherence, execute the strategic plan, and develop a collaborative, trusted, and results-oriented culture.
Why is this urgent?
Selecting an evidence-based policy, practice, or intervention is only the first step toward achieving the intended outcomes. Identifying and executing a consistent implementation plan that incorporates feedback and buy-in from stakeholders across the organization is a critical next step in the process that currently needs improvement.
Why these strategies?
Using implementation science and a continuous improvement cycle to coherently execute the actions of the strategic plan can improve the likelihood of implementing with fidelity and seeing the desired outcomes more quickly.This will also require a strong culture of collaborative project management to solve problems and promote a shared understanding of the actions needed and timelines that must be met to reach the desired outcomes.
Aligns with: All Goals and Guardrails; Transition Team Recommendations
5.2 Use Council of the Great City Schools Central Office structure audit recommendations to enhance the District organizational structure.
Why is this urgent?
Research suggests that the most critical action that districts can take to improve schools is to organize Central Office staff time and workflow around the needs of schools and school leaders. This requires all Central Office staff to understand how their work connects to creating the conditions necessary for effective teaching and learning. During the Listening and Learning Tour, District staff shared that Central Office departments are currently too siloed and disconnected. Offices too often do not seem to communicate or coordinate well with one another or with schools.
Why these strategies?
The Council of the Great City Schools, an organization tasked with convening, guiding, and supporting improvement of 78 the nation’s largest school districts, is completing an audit of the District’s internal structure, capacity, and areas of focus. Results are forthcoming and will be used to guide next steps in improving the District’s organizational structure in services of maximizing services to schools and students.
Aligns with: n/a
5.3 Implement a streamlined onboarding process to improve hiring timelines.
Why is this urgent?
During Listening and Learning sessions, leaders described a need to reexamine how we attract teachers and backfill positions with a greater sense of urgency. School leaders also said that staff burnout is the result of staff vacancies and substitute shortages, which creates additional challenges for the remaining teachers in the building.
Why these strategies?
Our current hiring process requires a timeline that does not meet the urgent need of schools to be fully staffed and able to provide students with a quality education. The length of the hiring process and the resulting disruptions of late hiring may lead to hiring lower quality candidates, insufficient time to onboard and develop teachers, less effective teachers in high-need classrooms, and reductions in student achievement. Reducing the length of vacancies would also likely improve the attendance and retention of staff.
Aligns with: Transition Team Recommendations
5.4 Develop succession plans at all levels of the organization.
Why is this urgent?
Turnover in senior leadership at the District is an ongoing concern and has increased in recent years. In addition to turnover, staff members may have long-term approved leave time, such as parental or medical leaves.Without a succession plan, the continuity of operations is disrupted because institutional knowledge and memory or authority to perform certain functions are not shared.
Why these strategies?
Turnover in districts, especially turnover of school and district leaders, can negatively impact student outcomes. Succession planning is an important feature of organizational stability, particularly in high turnover sectors, and can promote a smooth transition of talent when necessary. Succession planning requires identifying talent who can step into critical roles immediately and ensuring they have the institutional knowledge and development necessary to do so efficiently and effectively. Yet, succession planning is not the norm in education, nor have many districts strategically embraced the concept. Without careful planning for transitions, districts fall into the trap of simply replacing key staff members without the essential overlap and mentoring necessary to ensure more immediate efficacy.
Aligns with: n/a
5.5 Develop a project team to audit and make recommendations for student remote learning and staff remote work.
Why is this urgent?
Time is a precious resource. During Listening and Learning sessions, school leaders and students discussed the need for a more flexible approach to schooling that accommodates the differing needs of students, especially the need to complete high school while meeting competing economic demands. Leaders and students emphasized that a “one size fits all” approach to education is archaic and is not serving many students, instead forcing them to decide between work, family, and school obligations. Staff members shared similar needs for flexibility, noting that workplace flexibility is critical in attracting and retaining high quality Central Office employees, particularly those who could have workplace flexibility in similar positions in the private sector. Stakeholders also explained that allowing hybrid work ensures retention of employees with key institutional knowledge and demonstrates trust between employees.
Why these strategies?
Schools across the country are exploring and experimenting with innovative approaches to teaching and learning, especially after extended periods of virtual education during the COVID-19 pandemic. These alternatives include competency-based education, experiential learning, online and blended learning, and flexible scheduling. All of these alternatives seek to prioritize the student experience, promote an individualized instructional approach, and focus on mastery of knowledge and skills rather than seat time. Although extensive research points to the ways in which remote work increases productivity and employee satisfaction, wellbeing, and retention, especially for women with children, particular challenges exist when applying this concept to the education sector. The District has been experimenting with hybrid options for Central Office staff members but has yet to step back and identify the best practices for making hybrid work most productive in the educational setting.
Aligns with: All Goals
5.6 Develop a performance evaluation system for all Central Office staff.
Why is this urgent?
Stakeholders describe inconsistent effectiveness and competence across departments in Central Office, yet there is no evaluation system in place to determine to what extent Central Office staff members are meeting the expectations of their role in alignment with achieving our Goals and Guardrails.
Why these strategies?
Central Office performance reviews can be an important way to “define expectations, enhance communication, and prioritize district goals.” Effective evaluation systems can also be useful tools for promoting continuous improvement.
Aligns with: All Goals and Guardrails; Transition Team Recommendations
5.7 Launch an annual school leaders survey to provide feedback about Central Office operations.
Why is this urgent?
According to the findings from Listening and Learning sessions, many aspects of Central Office operations were viewed as needing improvement. Respondents said that some departments have good leadership, delegate and prioritize well, and work well with schools. However, other departments were seen as needing better leadership or better staffing to function effectively.
Why these strategies?
Districts with improved student outcomes have successfully pivoted Central Office duties from monitoring and compliance to actively and collaboratively supporting schools. One of the primary practices of districts who have made this change was the creation of a culture that establishes schools as the client of the central office and ensures that staff members have the mindsets, skills, and professional development to appropriately support schools.
Aligns with: All Goals and Guardrails; Transition Team Recommendations
5.8 Extend the operating budget development timeline and evidence-based budgeting practices to improve collaboration and transparency.
Why is this urgent?
During Listening and Learning sessions, stakeholders described wanting more input on how resources are allocated, and more consistency and predictability in the budgeting process to support school planning. Currently, there is a mismatch between the timeline for budgeting and other critical processes such as finalizing the annual school plan.
Why these strategies?
Research suggests that traditional budget processes do not ensure that funding decisions are aligned to implementing strategies that are most likely to move the needle on key performance indicators. An evidence-based budgeting process requires that funding requests be aligned to the organization’s mission and strategy. When possible, funding requests should also be supported by internal or external evidence of effectiveness.
Aligns with: All Goals and Guardrails; Transition Team Recommendations
5.9 Review the school selection process annually and implement national best practices.
Why is this urgent?
During the Listening and Learning sessions, stakeholders explained that they feel that the current school selection process is not equitable. School counselors, families, and students have expressed frustration navigating the application and enrollment process, and wish for better clarity and communication from the District.
Why these strategies?
Over the past decade, large urban districts, including Boston, New York, and Chicago, have revisited and reformed the process by which they determine which students are eligible and admitted to criteria based high schools.
Aligns with: All Goals and Guardrails; Transition Team Recommendations
5.10 Recruit executive(s) on loan to advise the Superintendent and Chief Operating Officer on facility challenges and operational efficiency.
Why is this urgent?
Facility challenges continue to plague the District; hundreds of District-operated school buildings have asbestos containing materials, many have notable lead issues, and over a hundred lack adequate air conditioning. These challenges often force schools to close early or entirely, impacting student and staff wellness and learning.
Why these strategies?
Literature from other fields suggest that advisory boards can have positive impacts on organizations, especially when those selected to advise have industry experience that speaks to the specific needs of the organization. By engaging with industry leaders, organizations can build their understanding of areas that are critical to the success of their mission and avoid pitfalls by relying on the knowledge of experienced professionals. Additionally, workplace coaching can have positive impacts on the performance of an organization by impacting a leader’s knowledge and confidence.
Aligns with: All Goals and Guardrails; Transition Team Recommendations
5.11 Provide the staffing, resources, and training necessary to meet school cleanliness standards.
Why is this urgent?
On the annual survey, less than 30% of students indicated that their building was clean, and only 35% of students indicated that their building was in good condition. Findings from Listening and Learning sessions echoed concerns that schools are not clean and facilities are not properly maintained. Currently, 1 in 10 custodial positions is vacant.
Why these strategies?
School cleanliness affects school climate, attendance, and achievement, and multiple studies have shown there is a direct connection between custodial staffing and building conditions. Maintaining environmentally safe and clean facilities also helps reduce student absences and teacher sick days.
Aligns with: Guardrail 1
5.12 Benchmark District performance against other large urban districts, utilizing Key Performance Indicators (KPIs) from the Council of the Great City Schools (CGCS) in: Academics, Finance, Procurement, Human Resources, Information Technology, and Operations.
Why is this urgent?
The role of the Central Office in ensuring that data is reliable and useful is imperative to the success of schools. Beyond collection and provision of data, effective data use by schools requires that the Central Office models best practices of data use, communicates expectations for and supports data use across the system, and convenes critical conversations that center on performance data. According to the annual survey, there is variation in the extent to which school leaders use data to make decisions.
Why these strategies?
Developing a data strategy is an essential foundational activity. There is currently no indicator of how effectively Central Office staff are using data to make decisions, nor is there a clear expectation of how data is used across the Central Office. Research indicates that access to reliable data and professional development on the use of evidence-based decision making protocols, such as the Team Initiated Problem Solving process, can improve teams’ ability to use data effectively, implement actions and interventions aimed at areas of concern, and improve student outcomes. It is imperative to start with a focused set of Key Performance Indicators that we can benchmark against other districts nationally.
Aligns with: All Goals and Guardrails
Supporting Research
290. Many reports from the District’s Office of Research and Evaluation have cited implementation challenges as a primary barrier in achieving the goals of the program, practice, or intervention.
291. Moir, T. (2018, July). Why is implementation science important for intervention design and evaluation within educational settings?. Frontiers in Education 3(61). Frontiers Media SA.
292. Best, J., & Dunlap, A. (2014). Continuous Improvement in Schools and Districts: Policy Considerations. McREL International.
293. Lyon, A. R., Cook, C. R., Brown, E. C., Locke, J., Davis, C., Ehrhart, M., & Aarons, A. (2018). Assessing organizational implementation context in the education sector: Confirmatory factor analysis of measures of implementation leadership, climate, and citizenship. Implementation Science, 13, 1-14.
294. Honig, M. I., Copland, M. A., Rainey, L., Lorton, J. A., & Newton, M. (2010). Central office transformation for district-wide teaching and learning improvement. Center for the Study of Teaching and Policy, Seattle, WA.
295. Bottoms, G., & Schmidt-Davis, J. (2010). The three essentials: Improving schools requires district vision, district and state support, and principal leadership. Southern Regional Education Board (SREB).
296. Reitano, A., McCrossan, E., Fornaro, E., Pylvainen, H., Lesnick, J., and Wolford, T. (2023). Highlights of key findings from the Superintendent’s Listening and Learning Tour. School District of Philadelphia. https://www.philasd.org/ research/2023/01/23/highlights-of-key-findings-from-the-superintendents-listening-and-learning-tour/.
297. Council of the Great City Schools. (2023). About CGCS. https://www.cgcs.org/domain/16
298. Listening and Learning: Teacher attendance, student attendance, and dropout prevention. Spring 2023. Internal document.
299. Papay, J. P., & Kraft, M. A. (2016). The productivity costs of inefficient hiring practices: Evidence from late teacher hiring. Journal of Policy Analysis and Management, 35(4), 791-817.
300. Cieminski, A. B. (2018). Practices that support leadership succession and principal retention. Education Leadership Review, 19(1), 21-41.
301. Butler, K., & Roche-Terry, D. E., (2002). Succession planning: Putting an organization’s knowledge to work. Nature Biology, 20(2), 201-202.
302. Schmidt-Davis, J., & Bottoms, G. (2011). Who’s next? Let’s stop gambling on school performance and plan for principal succession. Atlanta, GA: Southern Regional Education Board.
303. Parfitt, C. M. (2017). Creating a succession-planning instrument for educational leadership. Education Leadership Review, 18(1), 21-36.
304. Hartle, T., & Thomas, K. (2006). Growing tomorrow’s school leaders: The challenge. https://dera.ioe.ac.uk/4929/7/Growing_Tomorrow%27s_School_Leaders_Redacted.pdf.
305. Hargreaves, A., & Fink, D. (2003). Sustaining leadership. Phi Delta Kappan, 84(9), 693-700.
306. Parfitt, C. M. (2017). Creating a succession-planning instrument for educational leadership. Education Leadership Review, 18(1), 21-36.
307. Hanover Research (2014). Best practices in succession planning. https://www.hanoverresearch.com/media/Best-Practices-in-Succession-Planning.pdf.
308. Listening and Learning: Teacher attendance, student attendance, and dropout prevention. Spring 2023. Internal document.
309. Reitano, A., McCrossan, E., Fornaro, E., Pylvainen, H., Lesnick, J., and Wolford, T. (2023). Highlights of key findings from the Superintendent’s Listening and Learning Tour. School District of Philadelphia. https://www.philasd.org/ research/2023/01/23/highlights-of-key-findings-from-the-superintendents-listening-and-learning-tour/.
310. Joan, D. R. (2013). Flexible learning as new learning design in classroom process to promote quality education. Journal on School Educational Technology, 9(1), 37-42.
311. Sturgis, C., & Patrick, S. (2010). When failure is not an option: Designing competency-based pathways for next generation learning. International Association for K-12 Online Learning.
312. Patrick, S., Kennedy, K., & Powell, A. (2013). Mean what you say: Defining and integrating personalized, blended and competency education. International Association for K-12 Online Learning.
313. Hauser, A. (2016). Looking under the hood of competency-based education: The relationship between competency-based education practices and students’ learning skills, behaviors, and dispositions. Washington, DC: American Institutes for Research.
314. Lund, S., Madgavkar, A., Manyika, J., & Smit, S. (2020). What’s next for remote work: An analysis of 2,000 tasks, 800 jobs, and nine countries. McKinsey Global Institute, 1-13.
315. Bloom, N., Han, R., & Liang, J. (2022). How hybrid working from home works out (No. w30292). National Bureau of Economic Research.
316. OECD (2021). The future of (remote?) work in the public service: Finding a new balance between remote and in-office presence.
317. Coker, D. C. (2021). Structure of remote work in public education: A rapid scoping review. International Research in Education. https://doi.org/10.5296/ire.v9i2.18474.
318. Reitano, A., McCrossan, E., Fornaro, E., Pylvainen, H., Lesnick, J., and Wolford, T. (2023). Highlights of key findings from the Superintendent’s Listening and Learning Tour. School District of Philadelphia. https://www.philasd.org/ research/2023/01/23/highlights-of-key-findings-from-the-superintendents-listening-and-learning-tour/.
319. School Administrators of Iowa & The Wallace Foundation. Central Office Leadership Performance Review: A systems approach. http://www.sai-iowa.org/Leadership/Standards%20and%20Evaluation/COEval.pdf.
320. Reitano, A., McCrossan, E., Fornaro, E., Pylvainen, H., Lesnick, J., and Wolford, T. (2023). Highlights of key findings from the Superintendent’s Listening and Learning Tour. School District of Philadelphia. https://www.philasd.org/ research/2023/01/23/highlights-of-key-findings-from-the-superintendents-listening-and-learning-tour/.
321. Ikemoto, G. (2021). Prioritizing principals guidebook: Central office practices that support school leaders. The school leadership district cohort. George W. Bush Institute, Education Reform Initiative.
322. Honig, M. I., Copland, M. A., Rainey, L., Lorton, J. A., & Newton, M. (2010). Central office transformation for district-wide teaching and learning improvement. Center for the Study of Teaching and Policy, Seattle, WA.
323. Reitano, A., McCrossan, E., Fornaro, E., Pylvainen, H., Lesnick, J., and Wolford, T. (2023). Highlights of key findings from the Superintendent’s Listening and Learning Tour. School District of Philadelphia. https://www.philasd.org/ research/2023/01/23/highlights-of-key-findings-from-the-superintendents-listening-and-learning-tour/.
324. Pew-MacArthur Results First Initiative. (2016). A guide to evidence-based budget development. https://www.pewtrusts.org/-/media/assets/2016/07/aguidetoevidencebasedbudgetdevelopment.pdf
325. Pew-MacArthur Results First Initiative. (2016). A guide to evidence-based budget development. https://www.pewtrusts.org/-/media/assets/2016/07/aguidetoevidencebasedbudgetdevelopment.pdf
326. Reitano, A., McCrossan, E., Fornaro, E., Pylvainen, H., Lesnick, J., and Wolford, T. (2023). Highlights of key findings from the Superintendent’s Listening and Learning Tour. School District of Philadelphia. https://www.philasd.org/ research/2023/01/23/highlights-of-key-findings-from-the-superintendents-listening-and-learning-tour/.
327. Wills, T., Lesnick, J. and Hawes, P. (2023) School selection: Enrollment of first-time 9th Graders at District high schools, 2019-20 though 2022-23. The School District of Philadelphia. https://www.philasd.org/research/wp-content /uploads/sites/90/2023/05/School-Selection-Enrollment-of-First-Time-9th-Graders-at-District-High-Schools-2019-20-through-2022-23_May_2023.pdf.
328. Nowaczyk, P. and Roy, Joydeep. (October 2016). A look at New York City’s public high school choice process, NYC Independent Budget Office. https://www.ibo.nyc.ny.us/iboreports/preferences-and-outcomes-a-look-at-new-york-citys-public-high-school-choice-process.pdf.
329. Nathanson, L., Corcoran, S., and Baker-Smith C. (2013) High school choice in New York City: A report on the school choices and placements of low-achieving students. Research Alliance for New York City Schools.
330. Pathak, P and Sonmez, T. (2013). School admissions reform in Chicago and England: Comparing mechanisms by their vulnerability to manipulation. American Economic Review 103(1), 80-106.
331. Schmidt, S. (2022, February 17). Research report calls lead levels in Philly schools “tip of the toxic iceberg.” WHYY. https://whyy.org/articles/researchers-cite-widespread-lead-contamination-in-water-at-philadelphia-schools/.
332. Mezzacappa, D., & Sitrin, C. (2023, April 17). Damaged asbestos closed three Philadelphia schools this year. More could be coming. Chalkbeat Philadelphia. https://philadelphia.chalkbeat.org/2023/4/17/23686494/philadelphia- schools-asbestos-facilities-watlington-closures-inspections-in-person-learning.
333. Mezzacappa, D. (2023, March 13). Philadelphia officials blast schools chief over asbestos woes, threaten to withhold funding. Chalkbeat Philadelphia. https://philadelphia.chalkbeat.orbg/2023/3/13/23638784/philadelphia- closed-schools-asbestos-facilities-funding-plan-city-council.
334. Courtney, W. T., Hartley, B. K., Rosswurm, M., LeBlanc, L. A., & Lund, C. J. (2021). Establishing and leveraging the expertise of advisory boards. Behavior Analysis in Practice, 14(1), 253-263.
335. Jones, R. J., Woods, S. A., & Guillaume, Y. R. (2016). The effectiveness of workplace coaching: A meta‐analysis of learning and performance outcomes from coaching. Journal of Occupational and Organizational Psychology, 98(2), 249-277.
336. Internal Data, Qlik Philly School Experience Survey, Accessed May, 2023.
337. Reitano, A., McCrossan, E., Fornaro, E., Pylvainen, H., Lesnick, J., and Wolford, T. (2023). Highlights of key findings from the Superintendent’s Listening and Learning Tour. School District of Philadelphia. https://www.philasd.org/ research/2023/01/23/highlights-of-key-findings-from-the-superintendents-listening-and-learning-tour/.
338. Internal Data, Qlik School Employee Hiring Application, Accessed May, 2023.
339. Schneider, M. (2002). Do school facilities affect academic outcomes? National Clearinghouse for Educational Facilities, Washington DC.
340. Campbell, J. L., & Bigger, A. S. (2008). Cleanliness & learning in higher education. Facilities Manager, 24(4), 28-36.
341. Lafortune, J., & Schönholzer, D. (2022). The impact of school facility investments on students and homeowners: Evidence from Los Angeles. American Economic Journal: Applied Economics, 14(3), 254-289.
342. Maxwell, L.E. (2016). School building condition, social climate, student attendance and academic achievement: A mediation model. Journal of Environmental Psychology, 46, 206-216. https://eric.ed.gov/?id=EJ1028857.
343. Woolner, P., & Uline, C. L. (2019). The school building as organizational agent: Leveraging physical learning environments to advance the educational enterprise. The SAGE Handbook of School Organization.
344. Uline, C., & Tschannen-Moran, M. (2008). The walls speak: the interplay of quality facilities, school climate, and student achievement. Journal of Educational Administration, 46(1), 55-73.
345. Study: Clean schools promote academic success. (2008, June 24). https://www.facilitiesnet.com/educationalfacilities/article/Study-Clean-Schools-Promote-Academic-Success-Facilities-Management-Educational-Facilities-News–9072.
346. Honig, M. I., & Venkateswaran, N. (2012). School–central office relationships in evidence use: Understanding evidence use as a systems problem. American Journal of Education, 118(2), 199-222.
347. Internal data, Qlik Philly School Experience Survey, Accessed May, 2023.
348. McKinsey & Company. (2019). Catch them if you can: How leaders in data and analytics have pulled ahead. https://www.mckinsey.com/capabilities/quantumblack/our-insights/catch-them-if-you-can-how-leaders-in-data-and-analytics-have-pulled-ahead.
349. Preston, A., Cusumano, D., & Todd, A. W. (2015). PBIS forum in brief: Team-Initiated problem solving. U. S. Department of Education, Office of Special Education Programs: National Technical Assistance Center on Positive Behavioral Interventions and Supports. https://fpg.unc.edu/sites/fpg.unc.edu/files/resource-files/ RDQ%20TIPS%20Brief.pdf.
350. Algozzine, B., Newton, J. S., Horner, R. H., Todd, A. W., & Algozzine, K. M. (2012). Development and technical characteristics of a team decision-making assessment tool: Decision observation, recording and analysis (DORA). Journal of Psychoeducational Assessment, 30, 237-249. https://doi.org/10.1177/0734282911423884.
351. Telzrow, C. F., McNamara, K., & Hollinger, C. L. (2000). Fidelity of problem-solving implementation and relationship to student performance. School Psychology Review, 29, 443-461.
The Strategic Planning Process will be driven by the following teams representing the wide variety of perspectives and diverse experience of our District community:
- Leadership Team: Group of 25 central office and school leaders that serve as the decision-making body for the Strategic Plan.
- Steering Committee: Group of 60 central office staff, school-based staff, parents, and students from across Philadelphia that generates the content of the Strategic Plan which is reviewed by the Leadership Team.
- Advisory Groups: Groups of community members who provide critical insights and feedback as pieces of the Strategic Plan are developed. The Steering Committee will engage Advisory Groups of parents/guardians, principals, teachers, school support staff, students, union leadership, and central office staff.

How are participants chosen?
In December, individuals from across the District were invited to apply to participate in the Strategic Planning Process. Over 350 individuals applied to participate representing nearly all District offices and school-based roles, as well as every region of the city and socio-economic group. The parents/guardian applicants represent students in every grade level, including rising Kindergarteners and recent graduates.
All applications were reviewed by the Strategic Plan Project Team with the goal of bringing together a cross-section of diverse individuals with varied experience, viewpoints, and engagement levels to maximize voices in the process. Individuals selected represent a wide variety of perspectives, experience, and the racial/ethnic makeup of our District community. The Strategic Planning Project Team was particularly focused on ensuring we received input from traditionally underrepresented groups, parents/guardians, and those who work with learners with unique needs. It is our goal to have a Strategic Planning Process that is inclusive and represents the varied perspectives of our community.
Participant Members
Leadership Team Members
*Below lists were updated on March 20, 2023.
- Ericka Andrews, M.Ed, LS Teacher/Special Education Compliance Monitor, Washington Grover Middle School
- Benaline O. Baluyot, Director of Office of Multilingual Curriculum and Programs
- Kevin Bethel, Chief Safety Officer
- Mr. Jason Carrión, Principal, Cayuga Elementary School
- Alexandra Coppadge, Chief of Communications and Customer Service
- Jane Cordero, M.Ed., NBCT, Special Education Teacher, Hill Freedman
- Dr. Michael Farrell, Chief Learning Officer
- Sarah Galbally, Interim Chief of Staff
- Dave Ham, Facilities Area Manager
- Melanie Harris, Chief of Information Technology
- Dr. Sabriya Jubilee, Chief, Equity
- Melanie A. Lewin, School Facilities Planner, Office of Capital Programs
- Karyn Lynch, Chief, Student Support Services
- Reggie McNeil, Chief Operating Officer
- Antoine O’Karma, Director Curriculum & Instruction ELA
- Tanya M. Pezanowski, Special Education Assistant, Penn Treaty
- Lynn Rosner Rauch, General Counsel
- ShaVon Savage, Deputy Superintendent of Academic Services
- Martha Schlatter, Professional Learning Specialist, Learning Network 6
- Larisa Shambaugh, Chief Talent Officer
- Dr. Noah Tennant, Assistant Superintendent, Learning Network 4
- Shakeera Warthen, Assistant Superintendent, Learning Network 8
- Tony B. Watlington, Sr., Ed.D., Superintendent
- Dr. Tonya Wolford, Chief, Evaluation, Research and Accountability
- Lauren Young, Director of Curriculum and Instruction
- Dave Zega, Deputy Chief for Strategic Planning
Steering Committee Members
*Below lists were updated on January 23, 2023.
- Michelle Armstrong, Executive Director, Office of Career and Technical Education
- Jayme Banks PsyD, MBA, Deputy Chief of Prevention, Intervention and Trauma
- Miulcaeli Batista, PhD, Executive Director, Office of Multilingual Curriculum and Programs
- Aja Beech, Parent
- Sonya Berry, Interim Chief of Special Education and Diverse Learners
- April Brown, Principal, T.K. Finletter Academic Plus Elementary School and Neubauer Senior Fellow
- Martel Brown, Sr., Parent
- Audrey Buglione, Deputy General Counsel
- Diane Castelbuono, Deputy Chief, Early Childhood Education
- Brandon Cummings, Director, Leadership Development
- Ms. Katharine Daley, ESL Teacher, William H. Ziegler
- Marcus A. Delgado M.Ed, CEO of One Bright Ray, Inc.
- Lincoln Farquharson, Transitional Support Instructor
- Dr. Nyshawana Francis-Thompson, Interim Chief of Curriculum and Instruction
- Ashley Glasgow-Crockett, Executive Director of Federal Programs and Compliance
- Abigail Gray, PhD, Deputy Chief, Office of School Climate & Culture
- Tomás Hanna, Associate Superintendent of Secondary Schools
- Judy Haughton, Principal, Swenson High School
- Oz Hill, Deputy Chief Operating Officer
- Rachel Holzman Esquire, Deputy Chief of The Office of Student Rights and Responsibilities
- Cassidy Jemo, M.Ed., Spanish Teacher, Strawberry Mansion High School
- Dr. Darryl Johnson Jr., Principal, G.W. Carver High School
- DawnLynne Kacer, Executive Director, Opportunity Network
- Dr. Katie Laputka, Teacher, Harding Middle School
- Dr. Joy Lesnick, Deputy Chief of Research, Evaluation, and Academic Partnerships
- Ayana Lewis, Esq., Executive Director, Office of Strategic Partnerships
- Marissa Litman, Director of Budget Policy & Analysis
- Tricia L. London, MS, Director, Office of School Safety
- Dr. Frank Machos, Executive Director, Office of the Arts & Creative Learning
- Gabriel Martinez, Student, Excel Academy South
- Kendra B. McDow MD, MPH, FAAP, School System Medical Officer
- Audriene McConico, M.Ed., Life Skills Support Teacher, Martha Washington
- Tim McKenna, Deputy Chief of Accountability
- Maureen McTamney, LCSW, HSV-SSW, STEP School Behavior Consultant, William Cramp
- Meredith Mehra, Deputy Chief, Teaching & Learning
- Amanda Mitchell, Executive Director, Recruitment
- Jenna Monley, Deputy Chief Family and Community Engagement
- Lena Namnun, Teacher, Frankford High School
- Catherine Nelson, J.D., M.Ed, Teacher Leader, Thomas G. Morton Elementary School
- Fran Newberg, Ed. D., Deputy Chief Office of Educational Technology
- Adam Northam, Director of Internal Communication
- Dr. Evelyn Nuñez, Associate Superintendent of Elementary Schools
- Rebeca Ortiz, Parent
- Deon Plummer, Climate Control Liaison, Steel
- Vanessa Renee, Deputy Chief, School Planning
- Sophia Roach, Student Board Representative, Philadelphia High School of Creative and Performing Arts
- Tammy Russell, Ph.D., School Counselor, Overbrook High School
- Fermin Santiago, Special Education One to One/Classroom Assistant, Bridesburg Elementary School
- Dr. Malika Savoy, Assistant Superintendent for Special Projects
- Love Speech, Student Board Representative, Kensington High School for Creative and Performing Arts
- Toni Marie Waddington, M.Ed., ELA Interventionist, James Rhoads
- Stephanie Waller, Director of Engagement and Operations, Charter Schools Office
- Ryan Villanueva, Equity Training Specialist
- Ericka Washington, Deputy Chief, Office of Student Enrollment and Placement
- Russell Washington, Ed.M., Director of Academic Programming and Support
- Jeron Williams II, Philadelphia Youth Commissioner, Central High School
- Lamar A. Williams, Parent
- Tyler J. Wims, MS, Director of Student Engagement and Achievement
- Dr. Laurena Zeller, Principal, Add B. Anderson
Advisory Group Members
School Leaders Advisory Group Members
- Milton Alexander, MEd., Deputy Superintendent, Camelot Academy
- Borislav Ben, Assistant Principal, John Marshall
- Sara Calabrese, Assistant Principal, Samuel Fels High School
- Lisette Agosto Cintron, Ed.D., Principal, Philadelphia Virtual Academy
- Kate Davis, President, Central High School
- Principal Phillip DeLuca, Principal, Samuel Gompers
- Ms. Siouda Douglas, Principal, Abram Jenks
- Dana Frye-Thompson, Assistant Principal, Mary McLeod Bethune
- Luis Garcia, Principal, Alexander K. McClure
- Charlotte Gillum-Maddox, Principal, Lewis Elkin
- Dr. Jennifer Hale, Assistant Principal, Dr. Ethel Allen
- Amber Hill, M.Ed., Assistant Principal, Prince Hall
- Todd Kimmel, Principal, Horatio B. Hackett
- Sherin Kurian, Principal, William H. Loesche
- Jennifer Lennon, MEd, Assistant Principal, Julia R. Masterman
- Dr. Mary Libby, Principal, Chester A. Arthur
- Meredith G. Lowe, M.Ed, Principal, Andrew J. Morrison
- Maggie Stephan McMillan, M.Ed., Assistant Principal, Murrell Dobbins
- Julio Nuñez, Assistant Principal, Gloria Casarez
- Nichole T. Polk, Principal, Potter-Thomas School
- Dr. Yonaira Rodriguez, Principal, Isaac A. Sheppard
- Zoe Rooney, Assistant Principal, Strawberry Mansion
- Angela Ryans, Assistant Principal, John F. McCloskey
- Susan Thompson, MSEd, Principal, George Washington High School
- Dr. April Voltz, Associate Vice President of Strategic Initiatives & Community Engagement, Gateway to College, CCP
Teachers Advisory Group Members
- Mary Beth Hertz, Author and Educator, Science Leadership Academy at Beeber
- Adam Blyweiss, CTE teacher, Jules E. Mastbaum
- Karl Budkevics, Teacher, Joseph Pennell
- Amy Ruth Bussmann, Teacher, Anne Frank
- Durba Chatterjee, ESL Teacher, Lewis Elkin
- Kate Conroy, ELA Teacher, William L. Sayre
- Jazmeen Dupree, Teacher, DeBurgos
- Glenza E. Lowman, Educator Advocate, Blankenburg
- Ms. Marita Fitzpatrick, MAT, Art teacher, William W. Bodine
- Michelle Frank, Music Teacher/Leader of Performing and Visual Arts, Franklin Learning Center
- Marian Gentile,Teacher, Camelot Academy Hunting Park
- Lisa Handy, M.Ed., Teacher, Mitchell
- Sarah Hines, Teacher, Potter-Thomas
- Duwaine Jenkins, Jr., Health & Physical Education Teacher, Bartram
- Kelly Johnson, M. Ed., Sp.Ed., Learning Support Teacher, Joseph W. Catharine
- Jenny Mathis, High School ESOL, English, History Teacher, Northeast
- Mrs. Dorothy Mayer, Teacher, Edwin Forrest
- Monique McCoy, M.Ed, Teacher, Northeast Propel Academy
- Margaret McCray, M.Ed., CSP, Teacher, Eleanor C. Emlen
- Ginger McHugh, Teacher, Alexander K. McClure
- Jenny Rypinski, Intervention Teacher, John H. Webster
- Kathleen Sannicks-Lerner, MEd, Writing Specialist, DeBurgos
- Terri Swan-Long, Teacher, Samuel Powel
- Njemele Tamala Anderson, Educator/Restorative Dean/SBTL, Strawberry Mansion
- Tonya Ware, 5th Grade Teacher, Northeast Propel Academy
School Support Staff Advisory Group Members
- Chau Anh Hua, Vietnamese BCA, Furness
- Beth Beitler, M.A.SEL, M.S.Ed., School Counselor, Webster
- Patrice Bertotto, School Based Teacher Leader, Willard School
- Marianne Connell, Administrative Assistant, Sharswood
- Caroline Couser, Paraprofessional, Rowen
- Amanda Roesly Díez, Ed.S, School Psychologist, Morris
- Jennifer Donohue, School-Based Academic Coach (SBAC), Locke
- Beth Fernando, MEd, BSN, CSN, School Nurse, Lankenau
- Officer Gordon, School Safety Officer, Houston
- Cory Haley, Ed.D., Evaluation Learning Specialist, Clemente
- Dorian Harris, Community Relations Liaison, Philadelphia Virtual Academy
- Emily Hunter M.Ed., BSN, RN, CSN, Certified School Nurse, Rhawnhurst
- Jennifer Keene, M.Ed, M.Ed, Substitute Teacher
- Alfred J. Koniecki Jr., M Ed, School Climate Manager, Kelly
- Takeia Lomax, Paraprofessional, Arts Academy at Benjamin Rush
- Evangelist Sheryl C. Mitchell, Special Education Assistant, Washington
- Dachelle Mitchell, Building Engineer, McClure
- Tania Neptune, Ed.S NCSP, School Psychologist, Bartram
- Sasha Smith, Special Education Classroom Assistant, Student Transition
- Waleska Steiner, Special Education Assistant, Carnell
- Cindy Stone, School Climate and Safety Specialist, Bache-Martin
- Lisa Wade, Community Resource Liaison, Clemente
- Nadine Woodberry, STEP Family Peer, Southwark
Central Office Staff Advisory Group Members
- Cecilia Bradbury, Director of Special Education
- Tiffany L Chalmus MS, LPC, After School Enrichment Program Coordinator
- Christina Clark, Communications Officer
- Dr. Amelia Coleman Brown, Assistant Superintendent
- Joana Díaz, Educational Technology Specialist – Integration Coach
- Emily Faxon, Project Manager, Chief of Schools
- Lisa Gambino, MSW, LCSW, Director of After School Enrichment
- Holli Goldenberg, Multilingual Manager
- Shirl Ishmael, ELA Curriculum Specialist
- Colleen Landy-Thomas, MS, Director, Education for Children and Youth Experiencing Homelessness
- DarRel Lucky, Community Outreach and External Affairs Coordinator
- Amy McCourt, M. Ed., Multilingual Manager
- Erin McCrossan, PhD, Senior Research Associate, Office of Research and Evaluation
- Jennifer Melendez, M. Ed., Principal Resident, Office of Leadership Development
- Eboni C. Osborne, M.S., BCBA, Director of Behavior Support for the Office of Specialized Services
- Tamika Rogers, M.Ed, Professional Learning Specialist LN8
- Jesse Rucco, Science Curriculum Specialist
- Paula Sahm, Educational Facilities Planner/Project Manager
- Thanimas Scott, Asst. Director of Financial Services
- Allison Seger, Lead Academic Coach
- Klarissa Spencer, M.A., M.Ed., Special Needs Coordinator – Pre-K Partnership Support
- Marille Thomas, Senior Project Manager, Office of Professional Learning
- Tamiko Ward, PMP, M.Ed., Director, Compliance Monitoring
- Dr. Kwame Williams, Executive Director Curriculum and Instruction
Parents/Guardians Advisory Group Members
- Kiyana Butler
- Nicole Copper
- Olga Doubrovskaia
- Abigail Ellis
- Donna Fields, RN, CBC, MPA
- Leslie Fortin, MPH
- Gretchen Hendricks
- Teresa Johnson-Duncan
- Jessie Keel, CPS
- Lydia Kim
- Priscilla Lo
- Lynette Lowman
- Leon McCrea II, MD, MPH
- Brittany McElwee
- Bukola Olaoluniyi
- Matthew Prochnow
- Jose Ramos
- Teresa M Rennie
- Marva Ross
- Kelly Smack, LSW
- Alexis Tingle
- Monica Wilmer
Union Leaders
- Bernadette Ambrose-Smith, President, School Police Association of Philadelphia (SPAP)
- Maria Bailey, Employer Relations Rep, 32BJ SEIU
- John Bynum, Assistant District Leader, 32BJ SEIU
- Kiara Coleman, Lead Organizer, Local 634 UNITEHERE
- Tanya Edmonds, Trustee, Local 634 UNITEHERE
- Julian Graham, Assistant Principal at South Philadelphia High School, Commonwealth Association of School Administrators (CASA)
- Jerry T. Jordan, President, Philadelphia Federation of Teachers (PFT)
- Lynne Millard, Principal Leadership Coach, Commonwealth Association of School Administrators (CASA)
- Deana Ramsey, Principal of Philadelphia Juvenile Justice Service Center School, Commonwealth Association of School Administrators (CASA)
- Karimah Randolph, Vice President, School Police Association of Philadelphia (SPAP)
- Denise Rogers, Special Assistant to the President, Philadelphia Federation of Teachers (PFT)
Community Leaders
- Ken Anderson, Vice President of Civic Affairs, The Chamber of Commerce of Greater Philadelphia
- Jenny Bogoni, Executive Director, Read by 4th
- Councilmember Kendra Brooks, Councilmember At-Large
- Rep. Donna Bullock, State Representative
- Morgan Cephas, Philadelphia House Delegation Chair
- Donna Cooper, Executive Director, Children First
- Becky Cornejo, Executive Director, Neubauer Family Foundation
- Reverend Luis Cortés, Jr., Founder and CEO, Esperanza
- Carolina DiGiorgio, CEO of Congreso
- Justin Ennis, Executive Director, ASAP
- Vanessa Garrett Harley, Esq., Deputy Mayor for the Office of Children and Families, City of Philadelphia
- Senator Vincent Hughes, Senator
- Andrea M. Kane, Ph.D., Professor of Practice, Education Leadership, University of Pennsylvania Graduate School of Education
- Lucy Kerman, PhD, Senior Advisor to the President, Drexel University
- Joanna McClinton, State Representative
- Maura McInerney, Legal Director, Education Law Center
- Donald D Moore, Pastor Mount Carmel Baptist Church
- Pedro A. Ramos, President & CEO, Philadelphia Foundation
- Jennifer Rodriquez, President & CEO, Hispanic Chamber of Commerce
- Nikil Saval, State Senator
- Dr. David Thomas, Vice President, Community College of Philadelphia
- Chase Trimmer, Philadelphia Director, Special Olympics Pennsylvania
- Reverend Dr. Alyn E. Waller, Senior Pastor, Enon Tabernacle Baptist Church
- Dr. Elliot Weinbaum, Chief Philanthropy Officer, William Penn Foundation
*Lists were updated on January 23, 2023.